
The navigation below allows you to jump to any table or figure within the SEER Cancer Statistics Review.
- First select the CSR Section, then a Table/Figure from that section.
- Use the Submit button to view the table or figure. You will have options to download a printer-friendly version (PDF) or the data table (CSV) as well.
To learn more about the Cancer Statistics Review and the statistics presented in this report, refer to the About the CSR (PDF, 523 KB) and Technical Notes (PDF, 687 KB) pages.
Download and Print: Download Printer-friendly PDF Download data
Figure 1.9
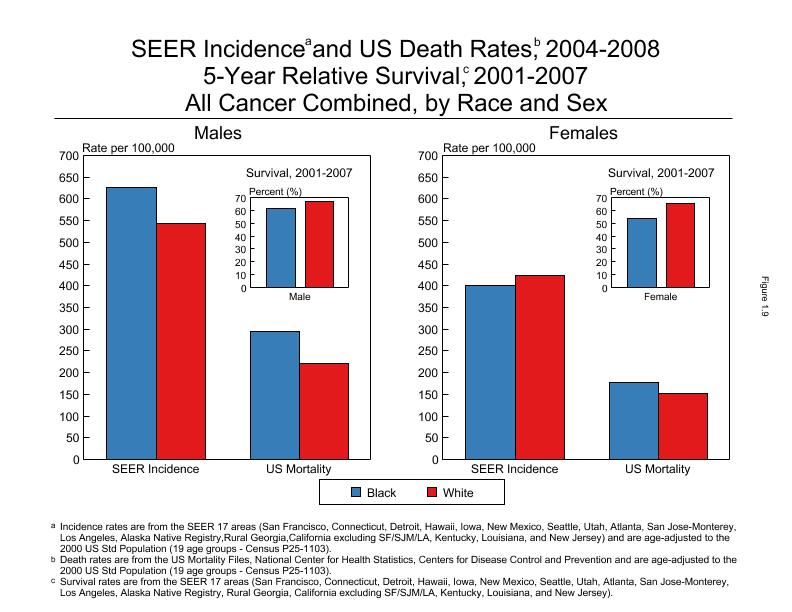
Figure 1.9
| Type of Rate | SEER Incidencea 2004-2008 Rate per 100,000 | US Mortalityb 2004-2008 Rate per 100,000 | 5-Year Relative Survivalc 2001-2007 (Percent) |
|---|---|---|---|
| Black Male | 626.1 | 295.3 | 61.1 |
| White Male | 543.6 | 220.0 | 66.5 |
| Black Female | 400.9 | 177.7 | 54.0 |
| White Female | 423.0 | 152.8 | 65.6 |
Footnotes:
aIncidence rates are from the SEER 17 areas (San Francisco, Connecticut, Detroit, Hawaii, Iowa, New Mexico, Seattle, Utah, Atlanta, San Jose-Monterey, Los Angeles, Alaska Native Registry, Rural Georgia,California excluding SF/SJM/LA, Kentucky, Louisiana, and New Jersey) and are age-adjusted to the 2000 US Std Population (19 age groups - Census P25-1103).
bDeath rates are from the US Mortality Files, National Center for Health Statistics, Centers for Disease Control and Prevention and are age-adjusted to the 2000 US Std Population (19 age groups - Census P25-1103).
cSurvival rates are from the SEER 17 areas (San Francisco, Connecticut, Detroit, Hawaii, Iowa, New Mexico, Seattle, Utah, Atlanta, San Jose-Monterey, Los Angeles, Alaska Native Registry, Rural Georgia, California excluding SF/SJM/LA, Kentucky, Louisiana, and New Jersey).
Page Navigation: << Previous Next >>
The information on this page is archived and provided for reference purposes only. Persons with disabilities having difficulty accessing information on this page may e-mail for assistance.