
The navigation below allows you to jump to any table or figure within the SEER Cancer Statistics Review.
- First select the CSR Section, then a Table/Figure from that section.
- Use the Submit button to view the table or figure. You will have options to download a printer-friendly version (PDF) or the data table (CSV) as well.
To learn more about the Cancer Statistics Review and the statistics presented in this report, refer to the About the CSR (PDF, 523 KB) and Technical Notes (PDF, 687 KB) pages.
Download and Print: Download Printer-friendly PDF Download data
Figure 1.11
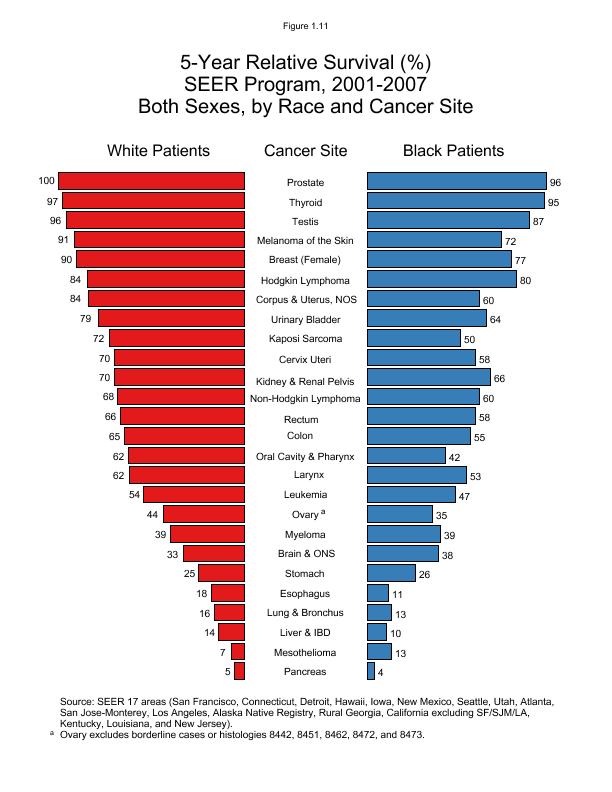
Figure 1.11
| Cancer Site | White 5-Year Relative Survival (Percent) | Black 5-Year Relative Survival (Percent) |
|---|---|---|
| Prostate | 100 | 96 |
| Thyroid | 97 | 95 |
| Testis | 96 | 87 |
| Melanoma of the Skin | 91 | 72 |
| Breast (Female) | 90 | 77 |
| Hodgkin Lymphoma | 84 | 80 |
| Corpus and Uterus, NOS | 84 | 60 |
| Urinary Bladder | 79 | 64 |
| Kaposi Sarcoma | 72 | 50 |
| Cervix Uteri | 70 | 58 |
| Kidney and Renal Pelvis | 70 | 66 |
| Non-Hodgkin Lymphoma | 68 | 60 |
| Rectum | 66 | 58 |
| Colon | 65 | 55 |
| Oral Cavity and Pharynx | 62 | 42 |
| Larynx | 62 | 53 |
| Leukemia | 54 | 47 |
| Ovarya | 44 | 35 |
| Myeloma | 39 | 39 |
| Brain and Other Nervous System | 33 | 38 |
| Stomach | 25 | 26 |
| Esophagus | 18 | 11 |
| Lung and Bronchus | 16 | 13 |
| Liver and Intrahepatic Bile Duct | 14 | 10 |
| Mesothelioma | 7 | 13 |
| Pancreas | 5 | 4 |
Footnotes:
Source: SEER 17 areas (San Francisco, Connecticut, Detroit, Hawaii, Iowa, New Mexico, Seattle, Utah, Atlanta, San Jose-Monterey, Los Angeles, Alaska Native Registry, Rural Georgia, California excluding SF/SJM/LA, Kentucky, Louisiana, and New Jersey).
aOvary excludes borderline cases or histologies 8442, 8451, 8462, 8472, and 8473.
Page Navigation: << Previous Next >>
The information on this page is archived and provided for reference purposes only. Persons with disabilities having difficulty accessing information on this page may e-mail for assistance.