
The navigation below allows you to jump to any table or figure within the SEER Cancer Statistics Review.
- First select the CSR Section, then a Table/Figure from that section.
- Use the Submit button to view the table or figure. You will have options to download a printer-friendly version or the data table (CSV) as well.
To learn more about the Cancer Statistics Review and the statistics presented in this report, refer to the About the CSR (PDF, 85 KB) and Technical Notes (PDF, 282 KB) pages.
Download and Print: Download Printer-friendly PDF Download data
Figure 1.18
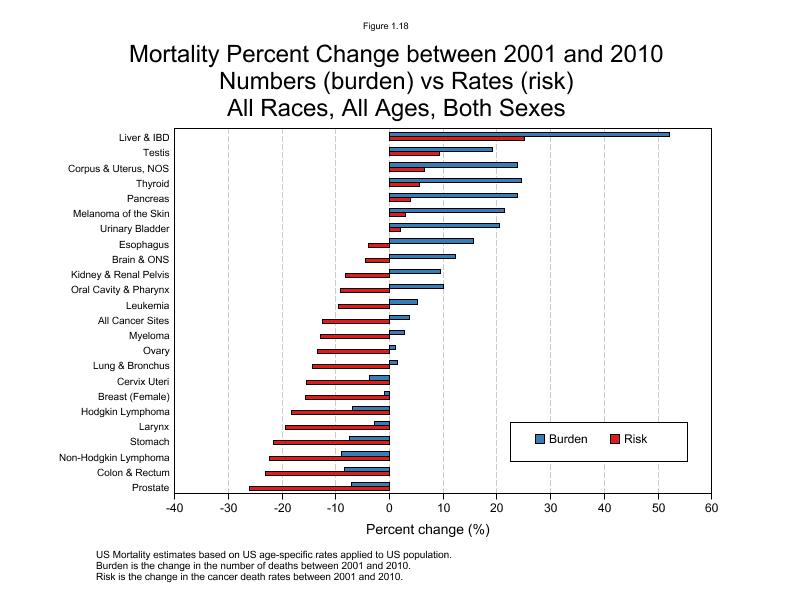
Figure 1.18
| Cancer Site | Burden Percent Change | Risk Percent Change |
|---|---|---|
| Liver & IBD | 52.1 | 25.2 |
| Testis | 19.1 | 9.3 |
| Corpus & Uterus, NOS | 23.9 | 6.6 |
| Thyroid | 24.5 | 5.6 |
| Pancreas | 23.8 | 3.9 |
| Melanoma of the Skin | 21.4 | 3.0 |
| Urinary Bladder | 20.5 | 2.0 |
| Esophagus | 15.7 | -3.9 |
| Brain & ONS | 12.3 | -4.5 |
| Kidney & Renal Pelvis | 9.4 | -8.2 |
| Oral Cavity & Pharynx | 10.0 | -9.1 |
| Leukemia | 5.3 | -9.5 |
| All Cancer Sites | 3.8 | -12.5 |
| Myeloma | 2.9 | -12.8 |
| Ovarya | 1.1 | -13.3 |
| Lung & Bronchus | 1.5 | -14.3 |
| Cervix Uteri | -3.7 | -15.4 |
| Breast (Female) | -1.0 | -15.7 |
| Hodgkin Lymphoma | -7.0 | -18.2 |
| Larynx | -2.8 | -19.5 |
| Stomach | -7.5 | -21.7 |
| Non-Hodgkin Lymphoma | -9.0 | -22.4 |
| Colon & Rectum | -8.4 | -23.0 |
| Prostate | -7.0 | -26.1 |
Footnotes:
US Mortality estimates based on US age-specific rates applied to US population.
Burden is the change in the number of deaths between 2001 and 2010.
Risk is the change in the cancer death rates between 2001 and 2010.
Page Navigation: << Previous Next >>
The information on this page is archived and provided for reference purposes only. Persons with disabilities having difficulty accessing information on this page may e-mail for assistance.