
The navigation below allows you to jump to any table or figure within the SEER Cancer Statistics Review.
- First select the CSR Section, then a Table/Figure from that section.
- Use the Submit button to view the table or figure. You will have options to download a printer-friendly version or the data table (CSV) as well.
To learn more about the Cancer Statistics Review and the statistics presented in this report, refer to the About the CSR (PDF, 85 KB) and Technical Notes (PDF, 282 KB) pages.
Download and Print: Download Printer-friendly PDF Download data
Figure 1.26
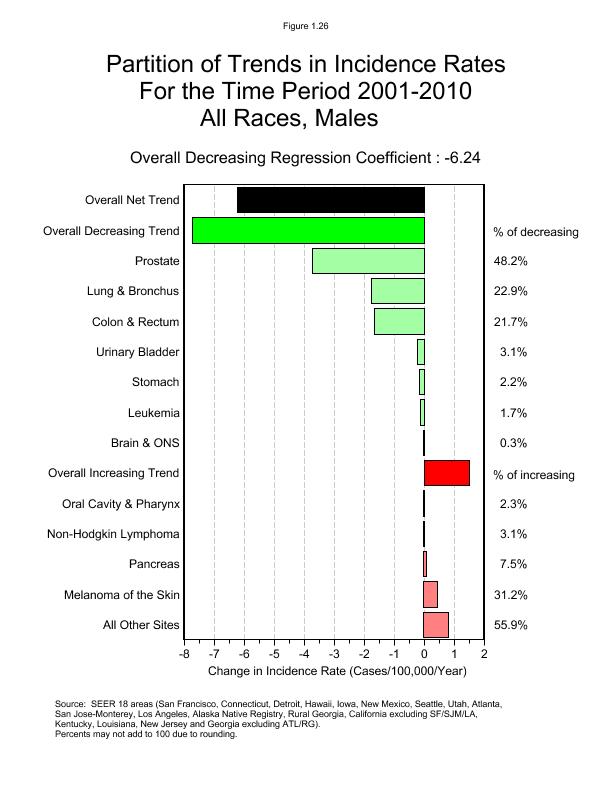
Figure 1.26
Partition of Trends in Incidence Rates for the Time Period 2001-2010
All Races, Males
| Overall Net Trend | -6.2378 |
|---|---|
| Overall Decreasing Trend | -7.7229 |
| Overall Increasing Trend | 1.4851 |
| Cancer Site | Change in Incidence Rate (Cases/100,000/Year) | Percent of Increasing/Decreasing Trend |
|---|---|---|
| Prostate | -3.7251 | 48.2% |
| Lung & Bronchus | -1.7672 | 22.9% |
| Colon & Rectum | -1.6732 | 21.7% |
| Urinary Bladder | -0.2356 | 3.1% |
| Stomach | -0.1693 | 2.2% |
| Leukemia | -0.1308 | 1.7% |
| Brain & ONS | -0.0216 | 0.3% |
| Oral Cavity & Pharynx | 0.0348 | 2.3% |
| Non-Hodgkin Lymphoma | 0.0461 | 3.1% |
| Pancreas | 0.1110 | 7.5% |
| Melanoma of the Skin | 0.4631 | 31.2% |
| All Other Sites | 0.8301 | 55.9% |
Footnotes:
Source: SEER 18 areas (San Francisco, Connecticut, Detroit, Hawaii, Iowa, New Mexico, Seattle, Utah, Atlanta, San Jose-Monterey, Los Angeles, Alaska Native Registry, Rural Georgia, California excluding SF/SJM/LA, Kentucky, Louisiana, New Jersey and Georgia excluding ATL/RG).
Percents may not add to 100 due to rounding.
Page Navigation: << Previous Next >>
The information on this page is archived and provided for reference purposes only. Persons with disabilities having difficulty accessing information on this page may e-mail for assistance.