
The navigation below allows you to jump to any table or figure within the SEER Cancer Statistics Review.
- First select the CSR Section, then a Table/Figure from that section.
- Use the Submit button to view the table or figure. You will have options to download a printer-friendly version or the data table (CSV) as well.
To learn more about the Cancer Statistics Review and the statistics presented in this report, refer to the About the CSR (PDF, 85 KB) and Technical Notes (PDF, 282 KB) pages.
Download and Print: Download Printer-friendly PDF Download data
Figure 1.3
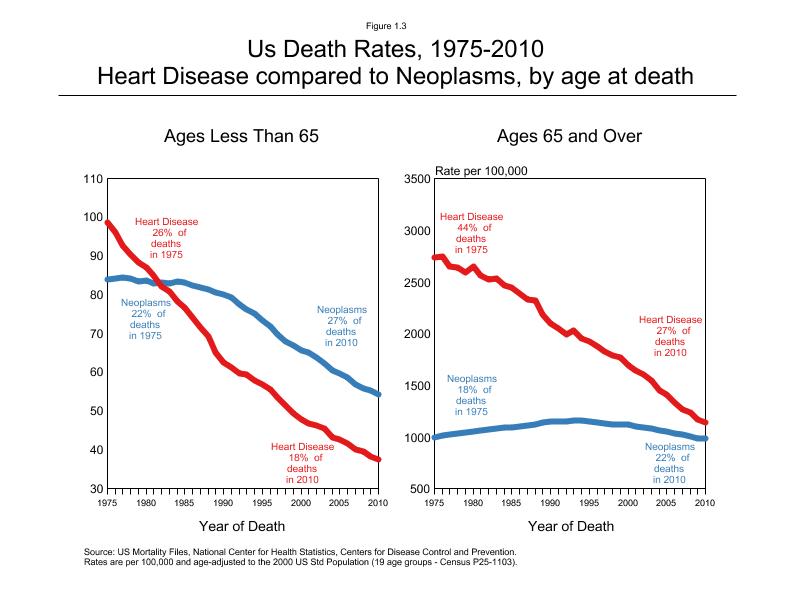
Figure 1.3
| Year of Death | Heart Disease, Ages <65 | Neoplasms, Ages <65 | Heart Disease, Ages 65+ | Neoplasms, Ages 65+ |
|---|---|---|---|---|
| 1975 | 98.6 | 84.0 | 2734.9 | 995.2 |
| 1976 | 95.9 | 84.3 | 2747.4 | 1018.3 |
| 1977 | 92.6 | 84.3 | 2656.3 | 1023.3 |
| 1978 | 90.4 | 84.2 | 2643.2 | 1035.4 |
| 1979 | 88.3 | 83.3 | 2595.8 | 1042.7 |
| 1980 | 86.9 | 83.7 | 2652.4 | 1059.1 |
| 1981 | 84.9 | 82.8 | 2568.9 | 1060.7 |
| 1982 | 82.0 | 83.0 | 2524.7 | 1074.6 |
| 1983 | 80.7 | 82.7 | 2532.4 | 1083.5 |
| 1984 | 78.3 | 83.3 | 2468.6 | 1093.0 |
| 1985 | 76.6 | 83.2 | 2449.2 | 1097.2 |
| 1986 | 74.0 | 82.2 | 2389.6 | 1107.5 |
| 1987 | 71.5 | 81.7 | 2333.4 | 1111.8 |
| 1988 | 69.1 | 81.3 | 2321.1 | 1120.3 |
| 1989 | 65.1 | 80.5 | 2184.9 | 1139.1 |
| 1990 | 62.4 | 80.1 | 2102.7 | 1147.4 |
| 1991 | 61.0 | 79.2 | 2054.6 | 1154.0 |
| 1992 | 59.7 | 77.4 | 1995.9 | 1153.7 |
| 1993 | 59.5 | 76.2 | 2027.9 | 1161.8 |
| 1994 | 57.8 | 75.0 | 1954.3 | 1157.0 |
| 1995 | 56.9 | 73.4 | 1927.5 | 1153.6 |
| 1996 | 55.5 | 71.7 | 1878.5 | 1142.2 |
| 1997 | 53.4 | 69.7 | 1828.4 | 1128.5 |
| 1998 | 51.4 | 67.9 | 1791.7 | 1119.6 |
| 1999 | 49.4 | 66.9 | 1766.3 | 1125.9 |
| 2000 | 47.7 | 65.5 | 1698.3 | 1119.8 |
| 2001 | 46.6 | 64.9 | 1648.2 | 1104.4 |
| 2002 | 46.3 | 63.7 | 1611.1 | 1097.2 |
| 2003 | 45.3 | 62.3 | 1551.7 | 1079.7 |
| 2004 | 43.1 | 60.4 | 1449.7 | 1060.8 |
| 2005 | 42.6 | 59.7 | 1415.4 | 1053.2 |
| 2006 | 41.5 | 58.5 | 1333.7 | 1036.1 |
| 2007 | 40.0 | 56.9 | 1268.7 | 1025.1 |
| 2008 | 39.5 | 55.8 | 1240.5 | 1009.5 |
| 2009 | 38.3 | 55.3 | 1174.6 | 989.8 |
| 2010 | 37.4 | 54.2 | 1143.5 | 984.1 |
In 1975, Heart Disease accounted for 26% of the deaths in the <65 age group.
In 1975, Neoplasms accounted for 22% of the deaths in the <65 age group.
In 2010, Heart Disease accounted for 18% of the deaths in the <65 age group.
In 2010, Neoplasms accounted for 27% of the deaths in the <65 age group.
In 1975, Heart Disease accounted for 44% of the deaths in the 65+ age group.
In 1975, Neoplasms accounted for 18% of the deaths in the 65+ age group.
In 2010, Heart Disease accounted for 27% of the deaths in the 65+ age group.
In 2010, Neoplasms accounted for 22% of the deaths in the 65+ age group.
Footnotes:
Source: US Mortality Files, National Center for Health Statistics, Centers for Disease Control and Prevention.
Rates are per 100,000 and age-adjusted to the 2000 US Std Population (19 age groups - Census P25-1103).
Page Navigation: << Previous Next >>
The information on this page is archived and provided for reference purposes only. Persons with disabilities having difficulty accessing information on this page may e-mail for assistance.