
The navigation below allows you to jump to any table or figure within the SEER Cancer Statistics Review.
- First select the CSR Section, then a Table/Figure from that section.
- Use the Submit button to view the table or figure. You will have options to download a printer-friendly version (PDF) or the data table (CSV) as well.
To learn more about the Cancer Statistics Review and the statistics presented in this report, refer to the About the CSR (PDF, 533 KB) and Technical Notes (PDF, 752 KB) pages.
Download and Print: Download Printer-friendly PDF Download data
Figure 1.1
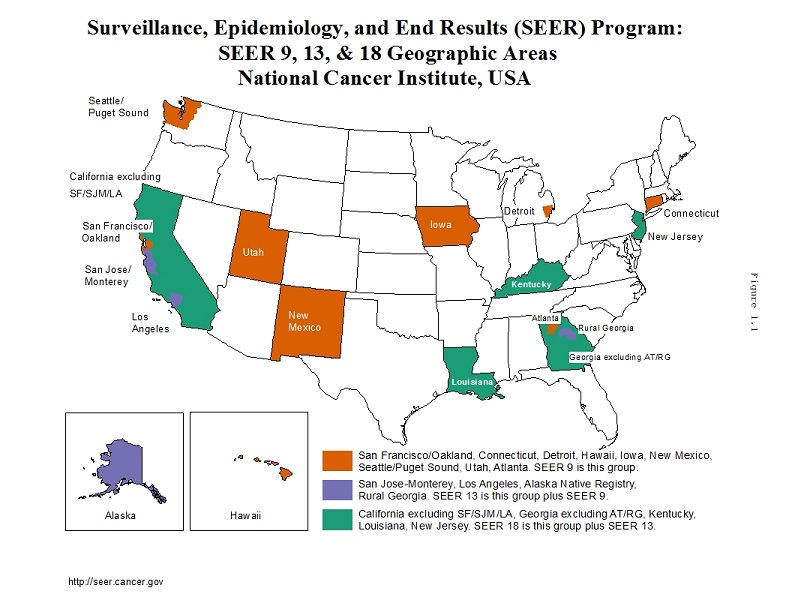
Figure 1.1
Surveillance, Epidemiology, and End Results (SEER) Program, National Cancer Institute, USA
| SEER Geographic Area | Registries Included |
|---|---|
| SEER 9 areas | San Francisco/Oakland, Connecticut, Detroit, Hawaii, Iowa, New Mexico, Seattle/Puget Sound, Utah, Atlanta. |
| SEER 13 areas | San Francisco/Oakland, Connecticut, Detroit, Hawaii, Iowa, New Mexico, Seattle/Puget Sound, Utah, Atlanta, San Jose-Monterey, Los Angeles, Alaska Native Registry, Rural Georgia. |
| SEER 18 areas | San Francisco/Oakland, Connecticut, Detroit, Hawaii, Iowa, New Mexico, Seattle/Puget Sound, Utah, Atlanta, San Jose-Monterey, Los Angeles, Alaska Native Registry, Rural Georgia, California (excluding the San Francisco/Oakland, San Jose-Monterey and Los Angeles registries), Kentucky, Louisiana, New Jersey, Georgia (excluding the Atlanta and Rural Georgia registries). |
Footnotes:
For more info please visit https://seer.cancer.gov
Page Navigation: << Previous Next >>
The information on this page is archived and provided for reference purposes only. Persons with disabilities having difficulty accessing information on this page may e-mail for assistance.