
The navigation below allows you to jump to any table or figure within the SEER Cancer Statistics Review.
- First select the CSR Section, then a Table/Figure from that section.
- Use the Submit button to view the table or figure. You will have options to download a printer-friendly version (PDF) or the data table (CSV) as well.
To learn more about the Cancer Statistics Review and the statistics presented in this report, refer to the About the CSR (PDF, 524 KB) and Technical Notes (PDF, 762 KB) pages.
Download and Print: Download Printer-friendly PDF Download data
Figure 15.4
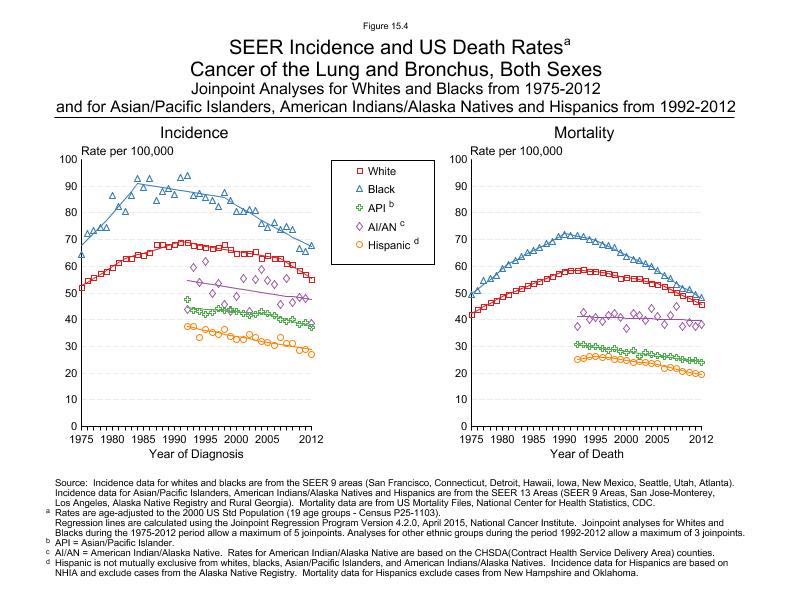
Figure 15.4
SEER Incidence and US Death Rates a
Cancer of the Lung and Bronchus, Both Sexes
Joinpoint Analyses for Whites and Blacks from 1975-2012 and for Asian/Pacific Islanders, American Indians/Alaska Natives and Hispanics from 1992-2012
| Year | White 1975-2012 | White 1975-2012 Modeled (from Joinpoint) | Black 1975-2012 | Black 1975-2012 Modeled (from Joinpoint) | Asian/Pacific Islander 1992-2012 | Asian/Pacific Islander 1992-2012 Modeled (from Joinpoint) | American Indian/Alaska Nativec 1992-2012 | American Indian/Alaska Nativec 1992-2012 Modeled (from Joinpoint) | Hispanicd 1992-2012 | Hispanicd 1992-2012 Modeled (from Joinpoint) |
|---|---|---|---|---|---|---|---|---|---|---|
| 1975 | 51.9 | 52.7 | 64.5 | 67.8 | ||||||
| 1976 | 54.6 | 54.1 | 72.3 | 70.1 | ||||||
| 1977 | 55.9 | 55.5 | 73.6 | 72.4 | ||||||
| 1978 | 57.2 | 56.9 | 74.4 | 74.8 | ||||||
| 1979 | 58.0 | 58.3 | 74.5 | 77.3 | ||||||
| 1980 | 59.4 | 59.8 | 86.6 | 79.8 | ||||||
| 1981 | 61.5 | 61.4 | 82.3 | 82.5 | ||||||
| 1982 | 63.1 | 62.9 | 80.4 | 85.2 | ||||||
| 1983 | 63.0 | 63.6 | 86.6 | 88.0 | ||||||
| 1984 | 64.3 | 64.3 | 92.9 | 90.9 | ||||||
| 1985 | 64.0 | 64.9 | 89.6 | 90.6 | ||||||
| 1986 | 65.1 | 65.6 | 92.9 | 90.2 | ||||||
| 1987 | 68.1 | 66.3 | 84.8 | 89.8 | ||||||
| 1988 | 68.2 | 67.0 | 88.1 | 89.4 | ||||||
| 1989 | 67.6 | 67.7 | 89.0 | 89.0 | ||||||
| 1990 | 68.2 | 68.5 | 86.8 | 88.6 | ||||||
| 1991 | 69.0 | 69.2 | 93.1 | 88.3 | ||||||
| 1992 | 68.9 | 68.8 | 94.0 | 87.9 | 47.5 | 44.4 | 44.0 | 54.5 | 37.4 | 37.4 |
| 1993 | 67.8 | 68.4 | 86.4 | 87.5 | 43.6 | 44.2 | 59.7 | 54.2 | 37.4 | 36.9 |
| 1994 | 67.3 | 68.0 | 87.2 | 87.1 | 43.1 | 44.0 | 54.1 | 53.8 | 33.3 | 36.5 |
| 1995 | 67.1 | 67.6 | 85.9 | 86.8 | 42.0 | 43.8 | 61.9 | 53.4 | 36.1 | 36.0 |
| 1996 | 66.8 | 67.2 | 84.5 | 86.4 | 42.6 | 43.7 | 49.9 | 53.1 | 35.3 | 35.5 |
| 1997 | 67.2 | 66.8 | 82.2 | 86.0 | 44.2 | 43.5 | 53.5 | 52.7 | 34.5 | 35.1 |
| 1998 | 68.0 | 66.4 | 87.6 | 85.7 | 43.5 | 43.3 | 45.5 | 52.3 | 36.5 | 34.6 |
| 1999 | 66.3 | 66.0 | 84.5 | 84.2 | 43.7 | 43.1 | 42.9 | 52.0 | 33.7 | 34.1 |
| 2000 | 64.6 | 65.6 | 80.4 | 82.8 | 43.2 | 42.9 | 48.8 | 51.6 | 32.7 | 33.7 |
| 2001 | 65.0 | 65.2 | 80.4 | 81.4 | 42.2 | 42.7 | 55.5 | 51.3 | 32.4 | 33.3 |
| 2002 | 64.7 | 64.8 | 81.2 | 80.0 | 41.7 | 42.5 | 43.0 | 50.9 | 34.6 | 32.8 |
| 2003 | 65.5 | 64.4 | 81.0 | 78.6 | 41.8 | 42.4 | 55.0 | 50.6 | 33.5 | 32.4 |
| 2004 | 62.8 | 64.0 | 76.1 | 77.3 | 43.2 | 42.2 | 58.9 | 50.2 | 31.9 | 32.0 |
| 2005 | 64.0 | 63.7 | 74.6 | 76.0 | 42.4 | 42.0 | 54.8 | 49.9 | 31.6 | 31.6 |
| 2006 | 62.8 | 63.3 | 76.5 | 74.7 | 41.7 | 41.3 | 53.3 | 49.5 | 30.4 | 31.1 |
| 2007 | 63.0 | 62.9 | 73.9 | 73.4 | 40.1 | 40.7 | 45.8 | 49.2 | 33.2 | 30.7 |
| 2008 | 61.1 | 61.3 | 74.8 | 72.2 | 39.4 | 40.0 | 55.4 | 48.8 | 30.9 | 30.3 |
| 2009 | 60.5 | 59.8 | 73.9 | 71.0 | 40.0 | 39.4 | 46.5 | 48.5 | 31.0 | 29.9 |
| 2010 | 58.6 | 58.3 | 66.8 | 69.8 | 38.2 | 38.7 | 48.3 | 48.2 | 28.5 | 29.5 |
| 2011 | 57.0 | 56.9 | 65.4 | 68.6 | 39.1 | 38.1 | 47.9 | 47.8 | 28.7 | 29.2 |
| 2012 | 54.9 | 55.4 | 68.0 | 67.4 | 37.0 | 37.5 | 38.5 | 47.5 | 27.1 | 28.8 |
| Year | White 1975-2012 | White 1975-2012 Modeled (from Joinpoint) | Black 1975-2012 | Black 1975-2012 Modeled (from Joinpoint) | Asian/Pacific Islander 1992-2012 | Asian/Pacific Islander 1992-2012 Modeled (from Joinpoint) | American Indian/Alaska Nativec 1992-2012 | American Indian/Alaska Nativec 1992-2012 Modeled (from Joinpoint) | Hispanicd 1992-2012 | Hispanicd 1992-2012 Modeled (from Joinpoint) |
|---|---|---|---|---|---|---|---|---|---|---|
| 1975 | 42.1 | 42.3 | 49.3 | 49.7 | ||||||
| 1976 | 43.7 | 43.5 | 51.1 | 51.5 | ||||||
| 1977 | 44.8 | 44.8 | 54.6 | 53.3 | ||||||
| 1978 | 46.3 | 46.1 | 55.3 | 55.1 | ||||||
| 1979 | 47.1 | 47.4 | 56.4 | 57.1 | ||||||
| 1980 | 48.8 | 48.8 | 59.2 | 59.1 | ||||||
| 1981 | 49.3 | 49.7 | 60.6 | 61.1 | ||||||
| 1982 | 50.8 | 50.6 | 62.3 | 62.3 | ||||||
| 1983 | 51.7 | 51.5 | 63.7 | 63.4 | ||||||
| 1984 | 52.6 | 52.5 | 65.1 | 64.6 | ||||||
| 1985 | 53.7 | 53.4 | 65.8 | 65.8 | ||||||
| 1986 | 54.4 | 54.4 | 67.0 | 67.1 | ||||||
| 1987 | 55.6 | 55.4 | 68.6 | 68.3 | ||||||
| 1988 | 56.4 | 56.4 | 69.2 | 69.6 | ||||||
| 1989 | 57.2 | 57.4 | 71.0 | 70.9 | ||||||
| 1990 | 58.2 | 58.5 | 72.1 | 72.3 | ||||||
| 1991 | 58.4 | 58.4 | 71.6 | 71.7 | ||||||
| 1992 | 58.3 | 58.3 | 71.4 | 71.2 | 30.6 | 30.8 | 37.3 | 41.2 | 25.2 | 25.2 |
| 1993 | 58.7 | 58.3 | 71.1 | 70.7 | 30.7 | 30.4 | 42.9 | 41.1 | 25.5 | 25.6 |
| 1994 | 58.2 | 58.2 | 70.2 | 70.2 | 29.8 | 30.0 | 40.2 | 41.1 | 26.1 | 25.9 |
| 1995 | 58.1 | 58.2 | 69.3 | 69.7 | 30.0 | 29.7 | 40.9 | 41.0 | 26.1 | 26.3 |
| 1996 | 57.7 | 57.7 | 68.3 | 68.6 | 29.1 | 29.3 | 39.4 | 40.9 | 25.8 | 26.0 |
| 1997 | 57.3 | 57.2 | 67.9 | 67.4 | 28.4 | 29.0 | 41.6 | 40.8 | 26.1 | 25.7 |
| 1998 | 56.9 | 56.7 | 66.9 | 66.3 | 29.1 | 28.7 | 42.4 | 40.8 | 25.2 | 25.3 |
| 1999 | 55.3 | 56.3 | 65.0 | 65.1 | 28.0 | 28.3 | 40.9 | 40.7 | 25.1 | 25.0 |
| 2000 | 56.0 | 55.8 | 63.8 | 64.0 | 27.7 | 28.0 | 36.7 | 40.6 | 24.6 | 24.7 |
| 2001 | 55.5 | 55.3 | 62.5 | 63.0 | 28.5 | 27.7 | 42.2 | 40.5 | 24.2 | 24.4 |
| 2002 | 55.3 | 54.9 | 62.0 | 61.9 | 26.1 | 27.3 | 41.6 | 40.5 | 24.4 | 24.1 |
| 2003 | 54.5 | 54.4 | 60.9 | 60.8 | 27.6 | 27.0 | 39.7 | 40.4 | 23.9 | 23.8 |
| 2004 | 53.7 | 54.0 | 59.8 | 59.8 | 26.8 | 26.7 | 44.3 | 40.3 | 23.4 | 23.5 |
| 2005 | 53.3 | 53.5 | 58.5 | 58.2 | 26.6 | 26.4 | 41.3 | 40.2 | 23.6 | 23.2 |
| 2006 | 52.3 | 52.4 | 56.7 | 56.6 | 26.1 | 26.1 | 38.1 | 40.2 | 21.8 | 22.6 |
| 2007 | 51.3 | 51.2 | 55.4 | 55.1 | 26.1 | 25.8 | 41.5 | 40.1 | 22.1 | 22.0 |
| 2008 | 50.3 | 50.1 | 53.1 | 53.6 | 25.8 | 25.5 | 45.0 | 40.0 | 21.9 | 21.5 |
| 2009 | 49.2 | 49.0 | 51.6 | 52.2 | 25.2 | 25.2 | 37.6 | 39.9 | 20.6 | 20.9 |
| 2010 | 48.1 | 47.9 | 51.2 | 50.8 | 24.6 | 24.9 | 39.1 | 39.9 | 20.3 | 20.4 |
| 2011 | 46.7 | 46.9 | 49.3 | 49.4 | 24.6 | 24.6 | 37.6 | 39.8 | 19.9 | 19.8 |
| 2012 | 45.7 | 45.8 | 48.4 | 48.1 | 24.0 | 24.3 | 38.4 | 39.7 | 19.4 | 19.3 |
Footnotes:
Source: Incidence data for whites and blacks are from the SEER 9 areas (San Francisco, Connecticut, Detroit, Hawaii, Iowa, New Mexico, Seattle, Utah, Atlanta). Incidence data for Asian/Pacific Islanders, American Indians/Alaska Natives and Hispanics are from the SEER 13 Areas (SEER 9 Areas, San Jose-Monterey, Los Angeles, Alaska Native Registry and Rural Georgia).
Mortality data are from US Mortality Files, National Center for Health Statistics, CDC.
a Rates are age-adjusted to the 2000 US Std Population (19 age groups - Census P25-1103).
Regression lines are calculated using the Joinpoint Regression Program Version 4.2.0, April 2015, National Cancer Institute. Joinpoint analyses for Whites and Blacks during the 1975-2012 period allow a maximum of 5 joinpoints. Analyses for other ethnic groups during the period 1992-2012 allow a maximum of 3 joinpoints.
c Rates for American Indian/Alaska Native are based on the CHSDA(Contract Health Service Delivery Area) counties.
d Hispanic is not mutually exclusive from whites, blacks, Asian/Pacific Islanders, and American Indians/Alaska Natives. Incidence data for Hispanics are based on NHIA and exclude cases from the Alaska Native Registry. Mortality data for Hispanics exclude cases from New Hampshire and Oklahoma.
Page Navigation: << Previous Next >>
The information on this page is archived and provided for reference purposes only. Persons with disabilities having difficulty accessing information on this page may e-mail for assistance.