
The navigation below allows you to jump to any table or figure within the SEER Cancer Statistics Review.
- First select the CSR Section, then a Table/Figure from that section.
- Use the Submit button to view the table or figure. You will have options to download a printer-friendly version (PDF) or the data table (CSV) as well.
To learn more about the Cancer Statistics Review and the statistics presented in this report, refer to the About the CSR (PDF, 524 KB) and Technical Notes (PDF, 762 KB) pages.
Download and Print: Download Printer-friendly PDF Download data
Figure 29.2
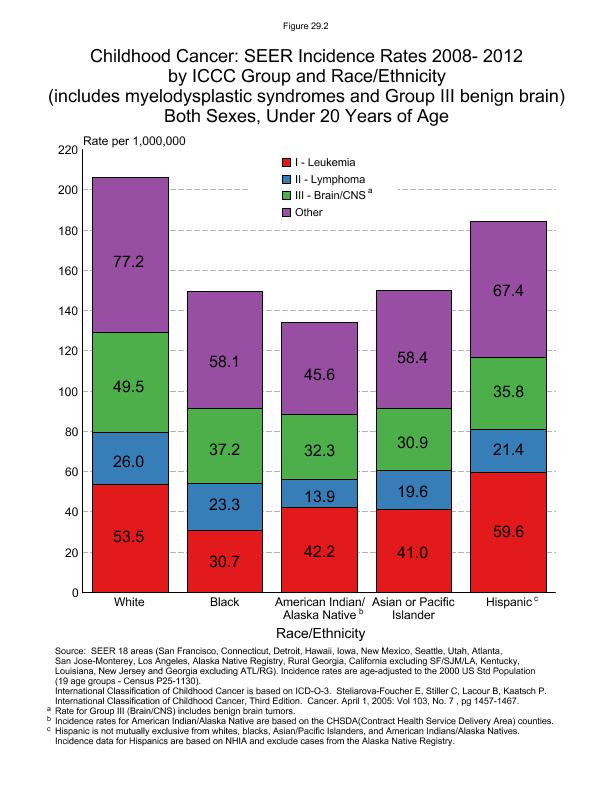
Figure 29.02
| Race/Ethnicity | I - Leukemia Rate per 1,000,000 | II - Lymphoma Rate per 1,000,000 | III - Brain/CNSa Rate per 1,000,000 | Other Rate per 1,000,000 |
|---|---|---|---|---|
| White | 53.5 | 26.0 | 49.5 | 77.2 |
| Black | 30.7 | 23.3 | 37.2 | 58.1 |
| American Indian/Alaska Nativeb | 42.2 | 13.9 | 32.3 | 45.6 |
| Asian or Pacific Islander | 41.0 | 19.6 | 30.9 | 58.4 |
| Hispanicc | 59.6 | 21.4 | 35.8 | 67.4 |
Footnotes:
Source: SEER 18 areas (San Francisco, Connecticut, Detroit, Hawaii, Iowa, New Mexico, Seattle, Utah, Atlanta, San Jose-Monterey, Los Angeles, Alaska Native Registry, Rural Georgia, California excluding SF/SJM/LA, Kentucky, Louisiana, New Jersey and Georgia excluding ATL/RG).
Incidence rates are age-adjusted to the 2000 US Std Population (19 age groups - Census P25-1130).
International Classification of Childhood Cancer is based on ICD-O-3. Steliarova-Foucher E, Stiller C, Lacour B, Kaatsch P. International Classification of Childhood Cancer, Third Edition. Cancer. April 1, 2005: Vol 103, No. 7 , pg 1457-1467.
aRate for Group III (Brain/CNS) includes benign brain tumors.
bIncidence rates for American Indian/Alaska Native are based on the CHSDA (Contract Health Service Delivery Area) counties.
cHispanic is not mutually exclusive from whites, blacks, Asian/Pacific Islanders, and American Indians/Alaska Natives.
Incidence data for Hispanics are based on NHIA and exclude cases from the Alaska Native Registry.
Page Navigation: << Previous Next >>
The information on this page is archived and provided for reference purposes only. Persons with disabilities having difficulty accessing information on this page may e-mail for assistance.