
The navigation below allows you to jump to any table or figure within the SEER Cancer Statistics Review.
- First select the CSR Section, then a Table/Figure from that section.
- Use the Submit button to view the table or figure. You will have options to download a printer-friendly version (PDF) or the data table (CSV) as well.
To learn more about the Cancer Statistics Review and the statistics presented in this report, refer to the About the CSR(PDF, 524KB) and Technical Notes(PDF, 752KB) pages.
Download and Print: Download Printer-friendly PDF Download data
Figure 20.1
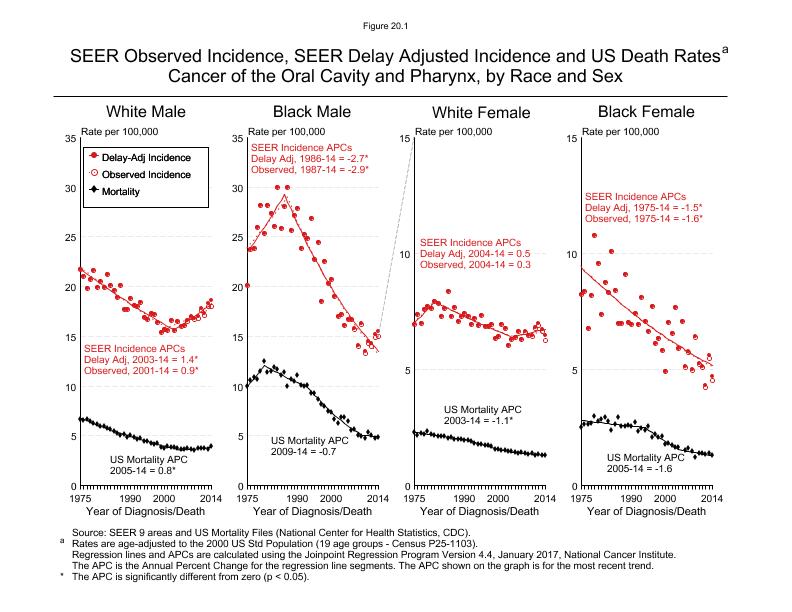
Figure 20.1
SEER Observed Incidence, SEER Delay Adjusted Incidence and US Death Rates a
Cancer of the Oral Cavity and Pharynx, by Race and Sex
- Rates per 100,000 for Oral Cavity and Pharynx, White, Male, 1975-2014, All Ages
- Rates per 100,000 for Oral Cavity and Pharynx, Black, Male, 1975-2014, All Ages
- Rates per 100,000 for Oral Cavity and Pharynx, White, Female, 1975-2014, All Ages
- Rates per 100,000 for Oral Cavity and Pharynx, Black, Female, 1975-2014, All Ages
- Annual Percent Changes for the most recent trend in the data series as calculated by Joinpoint.
Rates per 100,000 for Oral Cavity and Pharynx, White, Male, 1975-2014, All Ages
| Year | Delay-Adjusted SEER Incidence | Delay-Adjusted SEER Incidence Modeled (from Joinpoint) | Observed SEER Incidence | Observed SEER Incidence Modeled (from Joinpoint) | U.S. Mortality | U.S. Mortality Modeled (from Joinpoint) |
|---|---|---|---|---|---|---|
| 1975 | 21.7 | 21.8 | 21.7 | 21.9 | 6.6 | 6.8 |
| 1976 | 21.0 | 21.5 | 21.0 | 21.6 | 6.6 | 6.6 |
| 1977 | 19.9 | 21.3 | 19.9 | 21.4 | 6.7 | 6.5 |
| 1978 | 20.7 | 21.0 | 20.7 | 21.1 | 6.4 | 6.4 |
| 1979 | 21.6 | 20.8 | 21.6 | 20.8 | 6.3 | 6.2 |
| 1980 | 20.0 | 20.5 | 20.0 | 20.6 | 6.1 | 6.1 |
| 1981 | 20.5 | 20.3 | 20.5 | 20.3 | 6.0 | 6.0 |
| 1982 | 19.9 | 20.0 | 19.9 | 20.1 | 6.0 | 5.8 |
| 1983 | 21.2 | 19.8 | 21.2 | 19.8 | 5.7 | 5.7 |
| 1984 | 20.2 | 19.6 | 20.2 | 19.6 | 5.6 | 5.6 |
| 1985 | 19.6 | 19.4 | 19.6 | 19.3 | 5.4 | 5.5 |
| 1986 | 18.9 | 19.1 | 18.9 | 19.1 | 5.3 | 5.3 |
| 1987 | 20.1 | 18.9 | 20.1 | 18.9 | 5.0 | 5.2 |
| 1988 | 17.7 | 18.7 | 17.7 | 18.6 | 5.1 | 5.1 |
| 1989 | 17.7 | 18.5 | 17.7 | 18.4 | 4.8 | 5.0 |
| 1990 | 18.8 | 18.2 | 18.8 | 18.2 | 5.1 | 4.9 |
| 1991 | 18.1 | 18.0 | 18.1 | 17.9 | 4.9 | 4.8 |
| 1992 | 18.0 | 17.8 | 18.0 | 17.7 | 4.7 | 4.7 |
| 1993 | 18.4 | 17.6 | 18.4 | 17.5 | 4.7 | 4.6 |
| 1994 | 16.9 | 17.4 | 16.9 | 17.3 | 4.4 | 4.5 |
| 1995 | 16.7 | 17.2 | 16.7 | 17.1 | 4.4 | 4.4 |
| 1996 | 17.3 | 17.0 | 17.3 | 16.8 | 4.2 | 4.3 |
| 1997 | 17.2 | 16.8 | 17.2 | 16.6 | 4.2 | 4.2 |
| 1998 | 16.4 | 16.6 | 16.4 | 16.4 | 4.2 | 4.1 |
| 1999 | 15.4 | 16.4 | 15.4 | 16.2 | 3.8 | 4.0 |
| 2000 | 15.7 | 16.2 | 15.7 | 16.0 | 3.7 | 3.9 |
| 2001 | 15.6 | 16.0 | 15.6 | 15.8 | 3.9 | 3.9 |
| 2002 | 16.6 | 15.8 | 16.6 | 16.0 | 3.9 | 3.8 |
| 2003 | 15.6 | 15.6 | 15.6 | 16.1 | 3.8 | 3.7 |
| 2004 | 16.5 | 15.9 | 16.5 | 16.2 | 3.7 | 3.6 |
| 2005 | 16.0 | 16.1 | 16.0 | 16.4 | 3.6 | 3.5 |
| 2006 | 16.1 | 16.3 | 16.1 | 16.5 | 3.6 | 3.6 |
| 2007 | 16.6 | 16.6 | 16.5 | 16.7 | 3.7 | 3.6 |
| 2008 | 17.0 | 16.8 | 16.9 | 16.8 | 3.6 | 3.6 |
| 2009 | 16.8 | 17.0 | 16.7 | 17.0 | 3.5 | 3.7 |
| 2010 | 17.0 | 17.3 | 16.8 | 17.1 | 3.7 | 3.7 |
| 2011 | 17.8 | 17.5 | 17.6 | 17.3 | 3.7 | 3.7 |
| 2012 | 17.3 | 17.8 | 17.1 | 17.4 | 3.8 | 3.7 |
| 2013 | 18.3 | 18.0 | 18.0 | 17.6 | 3.7 | 3.8 |
| 2014 | 18.6 | 18.3 | 18.0 | 17.8 | 3.9 | 3.8 |
Rates per 100,000 for Oral Cavity and Pharynx, Black, Male, 1975-2014, All Ages
| Year | Delay-Adjusted SEER Incidence | Delay-Adjusted SEER Incidence Modeled (from Joinpoint) | Observed SEER Incidence | Observed SEER Incidence Modeled (from Joinpoint) | U.S. Mortality | U.S. Mortality Modeled (from Joinpoint) |
|---|---|---|---|---|---|---|
| 1975 | 20.2 | 23.5 | 20.2 | 23.9 | 9.9 | 10.0 |
| 1976 | 23.8 | 23.9 | 23.8 | 24.2 | 10.6 | 10.3 |
| 1977 | 23.9 | 24.4 | 23.9 | 24.6 | 10.9 | 10.7 |
| 1978 | 26.0 | 24.9 | 26.0 | 25.0 | 10.7 | 11.2 |
| 1979 | 28.2 | 25.4 | 28.2 | 25.5 | 11.5 | 11.6 |
| 1980 | 25.4 | 26.0 | 25.4 | 25.9 | 12.5 | 12.0 |
| 1981 | 28.2 | 26.5 | 28.2 | 26.3 | 11.4 | 11.9 |
| 1982 | 27.4 | 27.0 | 27.4 | 26.7 | 11.5 | 11.7 |
| 1983 | 26.1 | 27.6 | 26.1 | 27.1 | 11.8 | 11.5 |
| 1984 | 30.0 | 28.1 | 30.0 | 27.6 | 11.7 | 11.3 |
| 1985 | 25.8 | 28.7 | 25.8 | 28.0 | 11.0 | 11.1 |
| 1986 | 28.1 | 29.3 | 28.1 | 28.5 | 11.4 | 11.0 |
| 1987 | 30.0 | 28.5 | 30.0 | 29.0 | 10.0 | 10.8 |
| 1988 | 25.7 | 27.7 | 25.7 | 28.1 | 10.7 | 10.6 |
| 1989 | 27.2 | 27.0 | 27.2 | 27.3 | 10.4 | 10.5 |
| 1990 | 27.9 | 26.2 | 27.9 | 26.5 | 11.0 | 10.3 |
| 1991 | 23.8 | 25.5 | 23.8 | 25.8 | 10.1 | 10.2 |
| 1992 | 25.2 | 24.8 | 25.2 | 25.0 | 10.0 | 10.0 |
| 1993 | 24.9 | 24.1 | 24.9 | 24.3 | 10.1 | 9.9 |
| 1994 | 26.8 | 23.5 | 26.8 | 23.6 | 9.3 | 9.5 |
| 1995 | 22.7 | 22.8 | 22.7 | 23.0 | 9.3 | 9.1 |
| 1996 | 24.4 | 22.2 | 24.4 | 22.3 | 8.7 | 8.7 |
| 1997 | 18.5 | 21.6 | 18.5 | 21.7 | 8.1 | 8.3 |
| 1998 | 22.5 | 21.0 | 22.5 | 21.0 | 7.9 | 8.0 |
| 1999 | 20.3 | 20.4 | 20.3 | 20.4 | 7.5 | 7.7 |
| 2000 | 20.7 | 19.9 | 20.7 | 19.8 | 7.3 | 7.4 |
| 2001 | 19.0 | 19.3 | 19.0 | 19.3 | 6.7 | 7.1 |
| 2002 | 17.0 | 18.8 | 17.0 | 18.7 | 6.3 | 6.8 |
| 2003 | 17.2 | 18.3 | 17.2 | 18.2 | 6.9 | 6.5 |
| 2004 | 16.1 | 17.8 | 16.1 | 17.7 | 6.8 | 6.2 |
| 2005 | 16.7 | 17.3 | 16.7 | 17.2 | 6.4 | 6.0 |
| 2006 | 16.7 | 16.8 | 16.7 | 16.7 | 5.6 | 5.7 |
| 2007 | 15.8 | 16.4 | 15.7 | 16.2 | 5.6 | 5.5 |
| 2008 | 14.1 | 15.9 | 14.0 | 15.7 | 5.0 | 5.3 |
| 2009 | 16.3 | 15.5 | 16.2 | 15.3 | 5.0 | 5.1 |
| 2010 | 13.4 | 15.1 | 13.3 | 14.8 | 4.8 | 5.0 |
| 2011 | 14.5 | 14.6 | 14.3 | 14.4 | 5.4 | 5.0 |
| 2012 | 14.2 | 14.2 | 14.0 | 14.0 | 5.0 | 5.0 |
| 2013 | 15.2 | 13.9 | 14.9 | 13.6 | 4.8 | 4.9 |
| 2014 | 15.5 | 13.5 | 15.0 | 13.2 | 4.9 | 4.9 |
Rates per 100,000 for Oral Cavity and Pharynx, White, Female, 1975-2014, All Ages
| Year | Delay-Adjusted SEER Incidence | Delay-Adjusted SEER Incidence Modeled (from Joinpoint) | Observed SEER Incidence | Observed SEER Incidence Modeled (from Joinpoint) | U.S. Mortality | U.S. Mortality Modeled (from Joinpoint) |
|---|---|---|---|---|---|---|
| 1975 | 6.9 | 7.0 | 6.9 | 7.0 | 2.3 | 2.3 |
| 1976 | 7.4 | 7.1 | 7.4 | 7.2 | 2.2 | 2.3 |
| 1977 | 7.0 | 7.3 | 7.0 | 7.3 | 2.2 | 2.2 |
| 1978 | 7.6 | 7.4 | 7.6 | 7.4 | 2.2 | 2.2 |
| 1979 | 7.7 | 7.6 | 7.7 | 7.6 | 2.3 | 2.2 |
| 1980 | 7.6 | 7.8 | 7.6 | 7.8 | 2.2 | 2.2 |
| 1981 | 7.9 | 7.9 | 7.9 | 7.9 | 2.2 | 2.2 |
| 1982 | 7.9 | 7.8 | 7.9 | 7.8 | 2.1 | 2.1 |
| 1983 | 7.3 | 7.8 | 7.3 | 7.8 | 2.1 | 2.1 |
| 1984 | 7.6 | 7.7 | 7.6 | 7.7 | 2.1 | 2.1 |
| 1985 | 8.4 | 7.6 | 8.4 | 7.6 | 2.0 | 2.1 |
| 1986 | 7.3 | 7.6 | 7.3 | 7.6 | 2.1 | 2.1 |
| 1987 | 7.7 | 7.5 | 7.7 | 7.5 | 2.0 | 2.0 |
| 1988 | 7.1 | 7.4 | 7.1 | 7.4 | 2.0 | 2.0 |
| 1989 | 7.3 | 7.4 | 7.3 | 7.4 | 2.0 | 2.0 |
| 1990 | 7.4 | 7.3 | 7.4 | 7.3 | 2.0 | 2.0 |
| 1991 | 7.3 | 7.2 | 7.3 | 7.2 | 2.0 | 1.9 |
| 1992 | 6.9 | 7.1 | 6.9 | 7.2 | 1.9 | 1.9 |
| 1993 | 7.2 | 7.1 | 7.2 | 7.1 | 1.8 | 1.8 |
| 1994 | 6.9 | 7.0 | 6.9 | 7.0 | 1.8 | 1.8 |
| 1995 | 7.3 | 7.0 | 7.3 | 7.0 | 1.8 | 1.8 |
| 1996 | 6.8 | 6.9 | 6.8 | 6.9 | 1.7 | 1.7 |
| 1997 | 6.9 | 6.8 | 6.9 | 6.8 | 1.7 | 1.7 |
| 1998 | 6.9 | 6.8 | 6.9 | 6.8 | 1.7 | 1.6 |
| 1999 | 6.4 | 6.7 | 6.4 | 6.7 | 1.5 | 1.6 |
| 2000 | 6.4 | 6.6 | 6.4 | 6.6 | 1.6 | 1.6 |
| 2001 | 7.0 | 6.6 | 7.0 | 6.6 | 1.5 | 1.5 |
| 2002 | 6.8 | 6.5 | 6.8 | 6.5 | 1.5 | 1.5 |
| 2003 | 6.0 | 6.5 | 6.0 | 6.5 | 1.5 | 1.5 |
| 2004 | 6.3 | 6.4 | 6.3 | 6.4 | 1.5 | 1.4 |
| 2005 | 6.4 | 6.4 | 6.4 | 6.4 | 1.4 | 1.4 |
| 2006 | 6.6 | 6.5 | 6.6 | 6.4 | 1.4 | 1.4 |
| 2007 | 6.3 | 6.5 | 6.3 | 6.5 | 1.4 | 1.4 |
| 2008 | 6.6 | 6.5 | 6.6 | 6.5 | 1.4 | 1.4 |
| 2009 | 6.5 | 6.6 | 6.4 | 6.5 | 1.3 | 1.4 |
| 2010 | 6.5 | 6.6 | 6.4 | 6.5 | 1.4 | 1.4 |
| 2011 | 6.8 | 6.6 | 6.8 | 6.5 | 1.3 | 1.3 |
| 2012 | 7.0 | 6.7 | 6.9 | 6.6 | 1.3 | 1.3 |
| 2013 | 6.7 | 6.7 | 6.6 | 6.6 | 1.3 | 1.3 |
| 2014 | 6.5 | 6.7 | 6.3 | 6.6 | 1.3 | 1.3 |
Rates per 100,000 for Oral Cavity and Pharynx, Black, Female, 1975-2014, All Ages
| Year | Delay-Adjusted SEER Incidence | Delay-Adjusted SEER Incidence Modeled (from Joinpoint) | Observed SEER Incidence | Observed SEER Incidence Modeled (from Joinpoint) | U.S. Mortality | U.S. Mortality Modeled (from Joinpoint) |
|---|---|---|---|---|---|---|
| 1975 | 8.2 | 9.4 | 8.2 | 9.4 | 2.5 | 2.8 |
| 1976 | 8.4 | 9.2 | 8.4 | 9.3 | 2.6 | 2.8 |
| 1977 | 6.8 | 9.1 | 6.8 | 9.1 | 2.6 | 2.8 |
| 1978 | 8.2 | 9.0 | 8.2 | 9.0 | 2.7 | 2.7 |
| 1979 | 10.8 | 8.8 | 10.8 | 8.9 | 3.0 | 2.7 |
| 1980 | 9.6 | 8.7 | 9.6 | 8.7 | 2.8 | 2.7 |
| 1981 | 7.4 | 8.6 | 7.4 | 8.6 | 2.8 | 2.7 |
| 1982 | 8.8 | 8.4 | 8.8 | 8.5 | 2.9 | 2.7 |
| 1983 | 8.3 | 8.3 | 8.3 | 8.3 | 2.8 | 2.7 |
| 1984 | 10.1 | 8.2 | 10.1 | 8.2 | 2.4 | 2.7 |
| 1985 | 8.4 | 8.1 | 8.4 | 8.1 | 2.6 | 2.6 |
| 1986 | 7.0 | 7.9 | 7.0 | 7.9 | 2.9 | 2.6 |
| 1987 | 7.0 | 7.8 | 7.0 | 7.8 | 2.5 | 2.6 |
| 1988 | 9.1 | 7.7 | 9.1 | 7.7 | 2.5 | 2.6 |
| 1989 | 7.0 | 7.6 | 7.0 | 7.6 | 2.6 | 2.6 |
| 1990 | 6.9 | 7.5 | 6.9 | 7.5 | 2.5 | 2.6 |
| 1991 | 7.4 | 7.3 | 7.4 | 7.3 | 2.7 | 2.5 |
| 1992 | 6.9 | 7.2 | 6.9 | 7.2 | 2.3 | 2.5 |
| 1993 | 8.1 | 7.1 | 8.1 | 7.1 | 2.4 | 2.5 |
| 1994 | 7.1 | 7.0 | 7.1 | 7.0 | 2.4 | 2.5 |
| 1995 | 6.7 | 6.9 | 6.7 | 6.9 | 2.5 | 2.4 |
| 1996 | 7.7 | 6.8 | 7.7 | 6.8 | 2.1 | 2.3 |
| 1997 | 6.1 | 6.7 | 6.1 | 6.7 | 2.2 | 2.2 |
| 1998 | 6.3 | 6.6 | 6.3 | 6.6 | 2.1 | 2.1 |
| 1999 | 5.8 | 6.5 | 5.8 | 6.5 | 2.1 | 2.0 |
| 2000 | 4.9 | 6.4 | 4.9 | 6.4 | 1.8 | 1.9 |
| 2001 | 7.0 | 6.3 | 7.0 | 6.3 | 1.8 | 1.8 |
| 2002 | 6.5 | 6.2 | 6.5 | 6.2 | 1.7 | 1.7 |
| 2003 | 7.7 | 6.1 | 7.7 | 6.1 | 1.6 | 1.6 |
| 2004 | 5.9 | 6.0 | 5.9 | 6.0 | 1.6 | 1.6 |
| 2005 | 7.1 | 5.9 | 7.1 | 5.9 | 1.4 | 1.5 |
| 2006 | 5.1 | 5.8 | 5.1 | 5.8 | 1.5 | 1.5 |
| 2007 | 5.8 | 5.7 | 5.8 | 5.7 | 1.6 | 1.4 |
| 2008 | 5.0 | 5.7 | 5.0 | 5.6 | 1.5 | 1.4 |
| 2009 | 6.4 | 5.6 | 6.4 | 5.5 | 1.2 | 1.4 |
| 2010 | 5.3 | 5.5 | 5.2 | 5.4 | 1.4 | 1.4 |
| 2011 | 5.1 | 5.4 | 5.1 | 5.4 | 1.4 | 1.4 |
| 2012 | 4.3 | 5.3 | 4.2 | 5.3 | 1.3 | 1.3 |
| 2013 | 5.6 | 5.2 | 5.5 | 5.2 | 1.4 | 1.3 |
| 2014 | 4.7 | 5.2 | 4.5 | 5.1 | 1.3 | 1.3 |
Annual Percent Changes for the most recent trend in the data series as calculated by Joinpoint
Oral Cavity and Pharynx, All Ages, 1975-2014
| Data Series | Year Range for APC | APC |
|---|---|---|
| Delay-Adjusted SEER Incidence, White, Male | 2003-14 | 1.4* |
| Observed SEER Incidence, White, Male | 2001-14 | 0.9* |
| U.S. Mortality, White, Male | 2005-14 | 0.8* |
| Delay-Adjusted SEER Incidence, Black, Male | 1986-14 | -2.7* |
| Observed SEER Incidence, Black, Male | 1987-14 | -2.9* |
| U.S. Mortality, Black, Male | 2009-14 | -0.7 |
| Delay-Adjusted SEER Incidence, White, Female | 2004-14 | 0.5 |
| Observed SEER Incidence, White, Female | 2004-14 | 0.3 |
| U.S. Mortality, White, Female | 2003-14 | -1.1* |
| Delay-Adjusted SEER Incidence, Black, Female | 1975-14 | -1.5* |
| Observed SEER Incidence, Black, Female | 1975-14 | -1.6* |
| U.S. Mortality, Black, Female | 2005-14 | -1.6 |
Footnotes:
a Source: SEER 9 areas and US Mortality Files (National Center for Health Statistics, CDC). Rates are age-adjusted to the 2000 US Std Population (19 age groups - Census P25-1103).
Regression lines and APCs are calculated using the Joinpoint Regression Program Version 4.4, January 2017, National Cancer Institute.
The APC is the Annual Percent Change for the regression line segments.
* The APC is significantly different from zero (p < 0.05).
Page Navigation: << Previous Next >>
The information on this page is archived and provided for reference purposes only. Persons with disabilities having difficulty accessing information on this page may e-mail for assistance.