
The navigation below allows you to jump to any table or figure within the SEER Cancer Statistics Review.
- First select the CSR Section, then a Table/Figure from that section.
- Use the Submit button to view the table or figure. You will have options to download a printer-friendly version (PDF) or the data table (CSV) as well.
To learn more about the Cancer Statistics Review and the statistics presented in this report, refer to the About the CSR(PDF, 524KB) and Technical Notes(PDF, 752KB) pages.
Download and Print: Download Printer-friendly PDF Download data
Figure 1.10
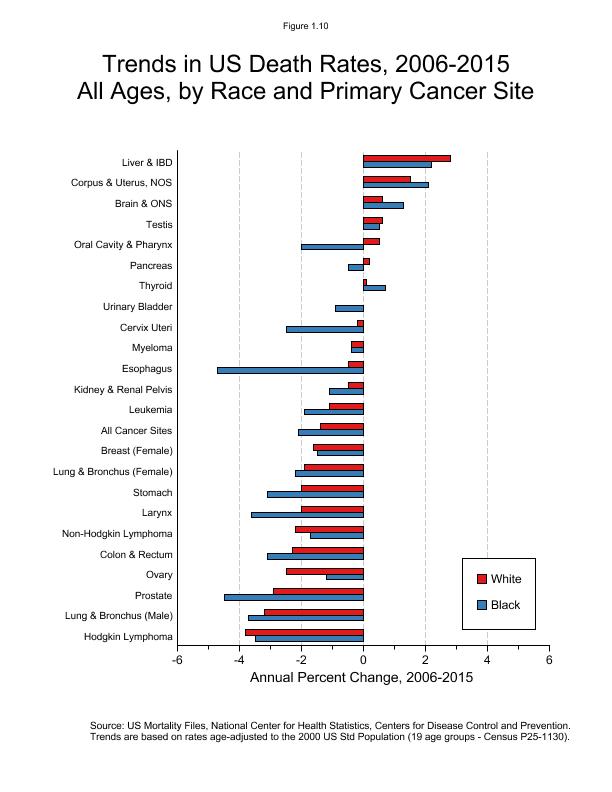
Figure 1.10
Trends in US Death Rates, 2006-2015
All Ages, by Race and Primary Cancer Site
| Primary Cancer Site | White APC 2006-2015 | Black APC 2006-2015 |
|---|---|---|
| Liver & IBD | 2.8 | 2.2 |
| Corpus & Uterus, NOS | 1.5 | 2.1 |
| Brain & ONS | 0.6 | 1.3 |
| Testis | 0.6 | 0.5 |
| Oral Cavity & Pharynx | 0.5 | -2.0 |
| Pancreas | 0.2 | -0.5 |
| Thyroid | 0.1 | 0.7 |
| Urinary Bladder | 0.0 | -0.9 |
| Cervix Uteri | -0.2 | -2.5 |
| Myeloma | -0.4 | -0.4 |
| Esophagus | -0.5 | -4.7 |
| Kidney & Renal Pelvis | -0.5 | -1.1 |
| Leukemia | -1.1 | -1.9 |
| All Cancer Sites | -1.4 | -2.1 |
| Breast (Female) | -1.6 | -1.5 |
| Lung & Bronchus (Female) | -1.9 | -2.2 |
| Stomach | -2.0 | -3.1 |
| Larynx | -2.0 | -3.6 |
| Non-Hodgkin Lymphoma | -2.2 | -1.7 |
| Colon & Rectum | -2.3 | -3.1 |
| Ovary | -2.5 | -1.2 |
| Prostate | -2.9 | -4.5 |
| Lung & Bronchus (Male) | -3.2 | -3.7 |
| Hodgkin Lymphoma | -3.8 | -3.5 |
Footnotes:
Source: US Mortality Files, National Center for Health Statistics, Centers for Disease Control and Prevention.
The APC is the Annual Percent Change over the time interval.
Trends are based on rates age-adjusted to the 2000 US Std Population (19 age groups - Census P25-1130).
Page Navigation: << Previous Next >>
The information on this page is archived and provided for reference purposes only. Persons with disabilities having difficulty accessing information on this page may e-mail for assistance.