
The navigation below allows you to jump to any table or figure within the SEER Cancer Statistics Review.
- First select the CSR Section, then a Table/Figure from that section.
- Use the Submit button to view the table or figure. You will have options to download a printer-friendly version (PDF) or the data table (CSV) as well.
To learn more about the Cancer Statistics Review and the statistics presented in this report, refer to the About the CSR (PDF, 528 KB) and Technical Notes (PDF, 794 KB) pages.
Download and Print: Download Printer-friendly PDF Download data
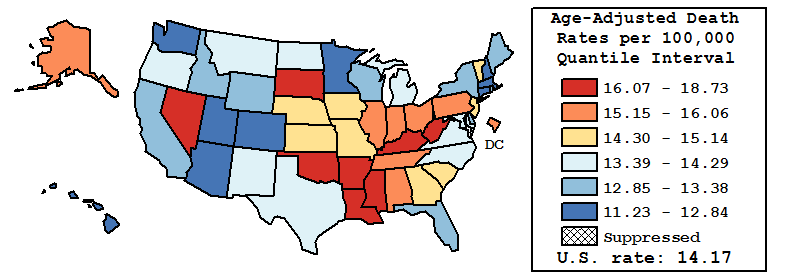
Table 6.25
Cancer of the Colon and Rectum (Invasive)
Age-adjusted Cancer Deatha Rates by State, All Races, 2012-2016
Males and Females
Total U.S. Rate compared to Five Highest and Five Lowest State Rates
| State | Rate | SE | Rank | PD |
|---|---|---|---|---|
| TOTAL U.S. | 14.17 | 0.03 | ||
| Mississippi | 18.73 | 0.34 | 01(01,02) | 32.15c |
| West Virginia | 18.22 | 0.39 | 02(01,04) | 28.50c |
| Oklahoma | 17.24 | 0.29 | 03(02,09) | 21.61c |
| Louisiana | 17.09 | 0.26 | 04(02,09) | 20.54c |
| Arkansas | 16.82 | 0.31 | 05(02,10) | 18.63c |
| Washington | 12.50 | 0.18 | 47(39,49) | -11.80c |
| Massachusetts | 12.29 | 0.18 | 48(42,49) | -13.30c |
| Colorado | 12.14 | 0.22 | 49(42,50) | -14.34c |
| Connecticut | 11.36 | 0.23 | 50(49,51) | -19.84c |
| Utah | 11.23 | 0.31 | 51(48,51) | -20.76c |
Individual State Rates
| State | Rate | SE | Rank | PD |
|---|---|---|---|---|
| Alabama | 16.06 | 0.24 | 09(05,15) | 13.29c |
| Alaska | 15.50 | 0.79 | 12(03,36) | 9.33 |
| Arizona | 12.84 | 0.18 | 43(33,48) | -9.43 |
| Arkansas | 16.82 | 0.31 | 05(02,10) | 18.63c |
| California | 12.94 | 0.08 | 41(36,46) | -8.72 |
| Colorado | 12.14 | 0.22 | 49(42,50) | -14.34c |
| Connecticut | 11.36 | 0.23 | 50(49,51) | -19.84c |
| Delaware | 13.35 | 0.49 | 35(20,49) | -5.84 |
| D.C. | 15.29 | 0.70 | 14(03,37) | 7.85 |
| Florida | 13.19 | 0.10 | 38(32,43) | -6.94 |
| Georgia | 15.12 | 0.18 | 18(11,23) | 6.70 |
| Hawaii | 12.81 | 0.39 | 44(27,49) | -9.60 |
| Idaho | 13.11 | 0.39 | 40(25,49) | -7.51 |
| Illinois | 15.26 | 0.15 | 16(11,21) | 7.63 |
| Indiana | 15.42 | 0.21 | 13(09,21) | 8.79 |
| Iowa | 15.07 | 0.28 | 20(10,26) | 6.28 |
| Kansas | 14.76 | 0.30 | 21(11,30) | 4.14 |
| Kentucky | 16.68 | 0.26 | 06(03,11) | 17.68c |
| Louisiana | 17.09 | 0.26 | 04(02,09) | 20.54c |
| Maine | 13.15 | 0.39 | 39(25,49) | -7.22 |
| Maryland | 14.06 | 0.21 | 27(21,35) | -0.83 |
| Massachusetts | 12.29 | 0.18 | 48(42,49) | -13.30c |
| Michigan | 14.17 | 0.16 | 26(21,32) | -0.04 |
| Minnesota | 12.65 | 0.20 | 46(36,49) | -10.79c |
| Mississippi | 18.73 | 0.34 | 01(01,02) | 32.15c |
| Missouri | 15.09 | 0.21 | 19(11,24) | 6.44 |
| Montana | 13.66 | 0.47 | 31(18,48) | -3.64 |
| Nebraska | 15.14 | 0.38 | 17(08,27) | 6.82 |
| Nevada | 16.64 | 0.34 | 07(03,12) | 17.42c |
| New Hampshire | 12.78 | 0.40 | 45(28,50) | -9.84 |
| New Jersey | 14.44 | 0.17 | 23(19,29) | 1.89 |
| New Mexico | 13.52 | 0.34 | 32(22,46) | -4.60 |
| New York | 13.24 | 0.11 | 36(31,43) | -6.61 |
| North Carolina | 13.80 | 0.16 | 30(24,37) | -2.61 |
| North Dakota | 13.95 | 0.59 | 28(11,48) | -1.56 |
| Ohio | 15.68 | 0.15 | 11(08,17) | 10.61c |
| Oklahoma | 17.24 | 0.29 | 03(02,09) | 21.61c |
| Oregon | 13.45 | 0.24 | 33(26,44) | -5.14 |
| Pennsylvania | 15.27 | 0.14 | 15(11,21) | 7.73 |
| Rhode Island | 13.22 | 0.45 | 37(22,49) | -6.77 |
| South Carolina | 14.65 | 0.23 | 22(14,29) | 3.36 |
| South Dakota | 16.45 | 0.58 | 08(02,21) | 16.03c |
| Tennessee | 15.79 | 0.21 | 10(07,18) | 11.39c |
| Texas | 14.29 | 0.11 | 25(21,29) | 0.82 |
| Utah | 11.23 | 0.31 | 51(48,51) | -20.76c |
| Vermont | 14.41 | 0.61 | 24(08,46) | 1.63 |
| Virginia | 13.90 | 0.18 | 29(23,36) | -1.93 |
| Washington | 12.50 | 0.18 | 47(39,49) | -11.80c |
| West Virginia | 18.22 | 0.39 | 02(01,04) | 28.50c |
| Wisconsin | 13.38 | 0.20 | 34(27,44) | -5.58 |
| Wyoming | 12.85 | 0.65 | 42(21,51) | -9.33 |
Footnotes:
a US Mortality Files, National Center for Health Statistics, Centers for Disease Control and Prevention. Rates are per 100,000 and are age-adjusted to the 2000 US Std Population (19 age groups - Census P25-1130).
b Difference between state rate and total U.S. rate is statistically significant (p<=.0002).
c Absolute percent difference between state rate and total U.S. rate is 10% or more.
d Rank of state level death rate and the 95% confidence intervals (low, high) for the rank.
SE Standard error of the rate.
PD Percent difference between state rate and total U.S. rate.
- Statistic not shown. Rate based on less than 16 cases for the time interval.
Page Navigation: << Previous Next >>
The information on this page is archived and provided for reference purposes only. Persons with disabilities having difficulty accessing information on this page may e-mail for assistance.