
The navigation below allows you to jump to any table or figure within the SEER Cancer Statistics Review.
- First select the CSR Section, then a Table/Figure from that section.
- Use the Submit button to view the table or figure. You will have options to download a printer-friendly version (PDF) or the data table (CSV) as well.
To learn more about the Cancer Statistics Review and the statistics presented in this report, refer to the About the CSR (PDF, 528 KB) and Technical Notes (PDF, 794 KB) pages.
Download and Print: Download Printer-friendly PDF Download data
Figure 4.6
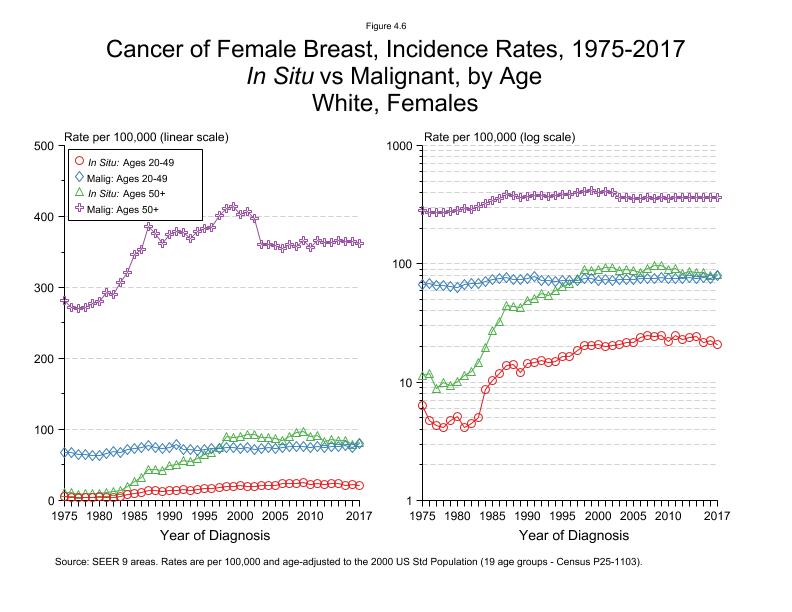
Figure 4.6
Cancer of Female Breast, Incidence Rates, 1975-2017 By Age, In Situ vs Malignant White
| Year | In Situ, Ages 20-49 Rate per 100,000 | Malignant, Ages 20-49 Rate per 100,000 | In Situ, Ages 50+ Rate per 100,000 | Malignant, Ages 50+ Rate per 100,000 |
|---|---|---|---|---|
| 1975 | 6.3252 | 67.3927 | 11.3256 | 281.9589 |
| 1976 | 4.7485 | 67.5670 | 11.8726 | 272.4903 |
| 1977 | 4.3335 | 64.9872 | 8.8500 | 271.0425 |
| 1978 | 4.1497 | 65.1150 | 9.9449 | 271.9723 |
| 1979 | 4.7236 | 63.9477 | 9.4055 | 277.8145 |
| 1980 | 5.0808 | 63.3758 | 10.1245 | 280.2406 |
| 1981 | 4.1250 | 66.2927 | 11.3064 | 292.7465 |
| 1982 | 4.4875 | 68.3310 | 12.2371 | 289.8037 |
| 1983 | 4.9955 | 67.6703 | 14.5710 | 307.2221 |
| 1984 | 8.6114 | 71.5034 | 19.6383 | 320.7942 |
| 1985 | 10.3809 | 73.5157 | 27.4004 | 346.2195 |
| 1986 | 11.9174 | 75.0866 | 32.6335 | 353.1792 |
| 1987 | 13.7055 | 76.9960 | 44.3603 | 385.8035 |
| 1988 | 14.0747 | 74.4198 | 43.2751 | 375.4660 |
| 1989 | 12.0146 | 73.7953 | 42.8379 | 362.6531 |
| 1990 | 14.4167 | 75.2282 | 49.1563 | 374.1862 |
| 1991 | 14.7753 | 78.4052 | 50.8651 | 378.7484 |
| 1992 | 15.2899 | 72.2694 | 56.0018 | 376.9092 |
| 1993 | 14.5337 | 71.6079 | 54.2534 | 368.4724 |
| 1994 | 14.9088 | 70.9303 | 59.2236 | 378.9910 |
| 1995 | 16.5522 | 72.5212 | 64.6431 | 383.5017 |
| 1996 | 16.3500 | 72.9224 | 68.1087 | 384.9958 |
| 1997 | 18.5050 | 72.9881 | 75.2851 | 400.8307 |
| 1998 | 20.4003 | 75.2466 | 89.8625 | 411.1937 |
| 1999 | 20.2484 | 74.6692 | 88.2470 | 414.3291 |
| 2000 | 20.7177 | 72.8577 | 89.9853 | 402.5120 |
| 2001 | 19.8678 | 74.2924 | 92.3404 | 407.5665 |
| 2002 | 20.3376 | 72.0477 | 92.9257 | 397.1770 |
| 2003 | 20.7643 | 73.4351 | 88.4682 | 361.2178 |
| 2004 | 21.5785 | 74.3755 | 88.8991 | 360.4737 |
| 2005 | 21.5541 | 73.6862 | 87.2915 | 358.9862 |
| 2006 | 23.8503 | 74.7675 | 83.9181 | 354.5321 |
| 2007 | 24.6356 | 75.7907 | 90.8320 | 360.0687 |
| 2008 | 24.4477 | 75.5113 | 96.1084 | 357.1077 |
| 2009 | 24.7926 | 76.3465 | 97.4183 | 366.4241 |
| 2010 | 21.8984 | 74.7450 | 89.5742 | 356.4517 |
| 2011 | 24.5826 | 75.4355 | 91.3982 | 365.4972 |
| 2012 | 23.0965 | 74.5463 | 83.2033 | 363.1551 |
| 2013 | 24.0341 | 76.1072 | 86.5241 | 363.4882 |
| 2014 | 24.1061 | 75.9022 | 84.3641 | 365.8373 |
| 2015 | 21.7124 | 77.0651 | 84.3061 | 365.1620 |
| 2016 | 22.3893 | 75.0607 | 78.9821 | 365.2870 |
| 2017 | 20.8256 | 80.1235 | 81.2087 | 362.2571 |
Footnotes:
Source: SEER 9 areas.
Rates are age-adjusted to the 2000 US Std Population (19 age groups - Census P25-1103).
Page Navigation: << Previous Next >>
The information on this page is archived and provided for reference purposes only. Persons with disabilities having difficulty accessing information on this page may e-mail for assistance.