
The navigation below allows you to jump to any table or figure within the SEER Cancer Statistics Review.
- First select the CSR Section, then a Table/Figure from that section.
- Use the Submit button to view the table or figure. You will have options to download a printer-friendly version (PDF) or the data table (CSV) as well.
To learn more about the Cancer Statistics Review and the statistics presented in this report, refer to the About the CSR (PDF, 727 KB) and Technical Notes (PDF, 1.1 MB) pages.
Download and Print: Download Printer-friendly PDF Download data
Figure 1.5
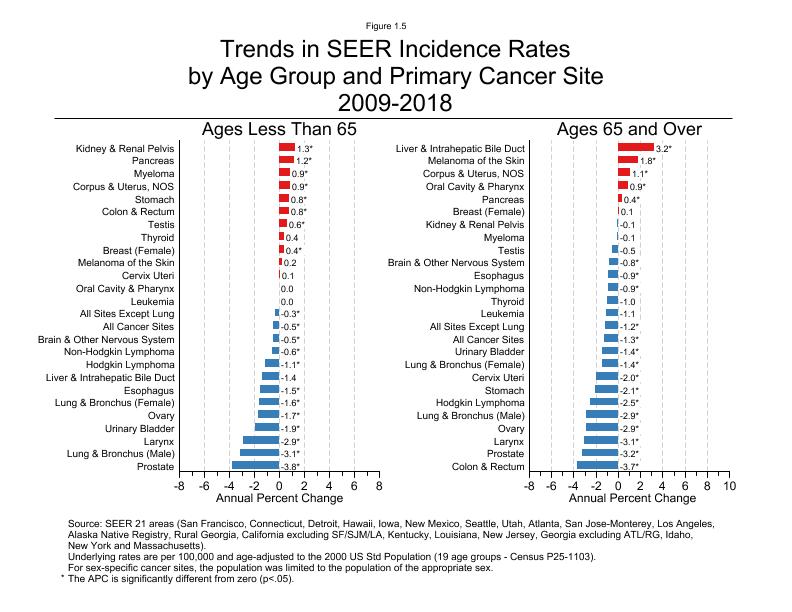
Figure 1.5
Trends in SEER Incidence Rates by Age Group and Primary Cancer Site, 2009-2018
Trends in SEER Incidence, Ages <65
| Cancer Site | Annual Percent Change, 2009-2018 |
|---|---|
| Kidney & Renal Pelvis | 1.3 * |
| Pancreas | 1.2 * |
| Myeloma | 0.9 * |
| Corpus & Uterus, NOS | 0.9 * |
| Stomach | 0.8 * |
| Colon & Rectum | 0.8 * |
| Testis | 0.6 * |
| Thyroid | 0.4 |
| Breast (Female) | 0.4 * |
| Melanoma of the Skin | 0.2 |
| Cervix Uteri | 0.1 |
| Oral Cavity & Pharynx | 0.0 |
| Leukemia | 0.0 |
| All Sites Except Lung & Bronchus | -0.3 * |
| All Cancer Sites | -0.5 * |
| Brain & Other Nervous System | -0.5 * |
| Non-Hodgkin Lymphoma | -0.6 * |
| Hodgkin Lymphoma | -1.1 * |
| Liver & Intrahepatic Bile Duct | -1.4 |
| Esophagus | -1.5 * |
| Lung & Bronchus (Female) | -1.6 * |
| Ovary a | -1.7 * |
| Urinary Bladder | -1.9 * |
| Larynx | -2.9 * |
| Lung & Bronchus (Male) | -3.1 * |
| Prostate | -3.8 * |
Trends in SEER Incidence, Ages 65+
| Cancer Site | Annual Percent Change, 2009-2018 |
|---|---|
| Liver & Intrahepatic Bile Duct | 3.2 * |
| Melanoma of the Skin | 1.8 * |
| Corpus & Uterus, NOS | 1.1 * |
| Oral Cavity & Pharynx | 0.9 * |
| Pancreas | 0.4 * |
| Breast (Female) | 0.1 |
| Kidney & Renal Pelvis | -0.1 |
| Myeloma | -0.1 |
| Testis | -0.5 |
| Brain & Other Nervous System | -0.8 * |
| Esophagus | -0.9 * |
| Non-Hodgkin Lymphoma | -0.9 * |
| Thyroid | -1.0 |
| Leukemia | -1.1 |
| All Sites Except Lung & Bronchus | -1.2 * |
| All Cancer Sites | -1.3 * |
| Urinary Bladder | -1.4 * |
| Lung & Bronchus (Female) | -1.4 * |
| Cervix Uteri | -2.0 * |
| Stomach | -2.1 * |
| Hodgkin Lymphoma | -2.5 * |
| Lung & Bronchus (Male) | -2.9 * |
| Ovary a | -2.9 * |
| Larynx | -3.1 * |
| Prostate | -3.2 * |
| Colon & Rectum | -3.7 * |
Footnotes:
Source: SEER 21 areas (San Francisco, Connecticut, Detroit, Hawaii, Iowa, New Mexico, Seattle, Utah, Atlanta, San Jose-Monterey, Los Angeles, Alaska Native Registry, Rural Georgia, California excluding SF/SJM/LA, Kentucky, Louisiana, New Jersey, Georgia excluding ATL/RG, Idaho, New York and Massachusetts)).
Underlying rates are per 100,000 and age-adjusted to the 2000 US Std Population (19 age groups - Census P25-1103).
For sex-specific cancer sites, the population was limited to the population of the appropriate sex.
* The APC is significantly different from zero (p<.05).
Page Navigation: << Previous Next >>
The information on this page is archived and provided for reference purposes only. Persons with disabilities having difficulty accessing information on this page may e-mail for assistance.