
The navigation below allows you to jump to any table or figure within the SEER Cancer Statistics Review.
- First select the CSR Section, then a Table/Figure from that section.
- Use the Submit button to view the table or figure. You will have options to download a printer-friendly version (PDF) or the data table (CSV) as well.
To learn more about the Cancer Statistics Review and the statistics presented in this report, refer to the About the CSR (PDF, 727 KB) and Technical Notes (PDF, 1.1 MB) pages.
Download and Print: Download Printer-friendly PDF Download data
Figure 1.14
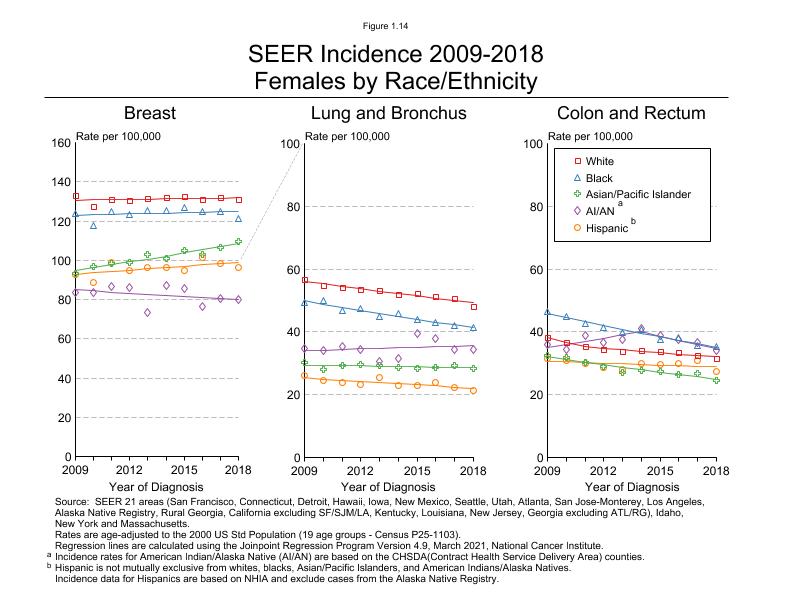
Figure 1.14
SEER Incidence 2009-2018
Females by Race/Ethnicity
Rates per 100,000 for Breast, Observed SEER Incidence, Female, 2006-2015, All Ages
| Year | White | White Modeled (from Joinpoint) | Black | Black Modeled (from Joinpoint) | Asian/Pacific Islander | Asian/Pacific Islander Modeled (from Joinpoint) | American Indian/Alaska Nativea | American Indian/Alaska Nativea Modeled (from Joinpoint) | Hispanicb | Hispanicb Modeled (from Joinpoint) |
|---|---|---|---|---|---|---|---|---|---|---|
| 2009 | 132.9 | 130.6 | 124.0 | 123.0 | 93.4 | 94.7 | 83.7 | 85.0 | 92.9 | 92.9 |
| 2010 | 127.6 | 130.8 | 117.7 | 123.2 | 96.7 | 96.2 | 83.5 | 84.4 | 88.4 | 93.5 |
| 2011 | 131.1 | 130.9 | 125.0 | 123.4 | 98.2 | 97.6 | 86.8 | 83.8 | 98.6 | 94.2 |
| 2012 | 130.4 | 131.0 | 123.3 | 123.6 | 98.7 | 99.1 | 86.3 | 83.2 | 94.9 | 94.9 |
| 2013 | 131.5 | 131.2 | 125.3 | 123.8 | 103.1 | 100.6 | 73.4 | 82.6 | 96.2 | 95.5 |
| 2014 | 131.9 | 131.3 | 125.5 | 124.0 | 100.9 | 102.1 | 87.2 | 82.1 | 96.2 | 96.2 |
| 2015 | 132.7 | 131.4 | 127.0 | 124.2 | 104.9 | 103.7 | 85.5 | 81.5 | 95.0 | 96.9 |
| 2016 | 130.9 | 131.6 | 125.0 | 124.4 | 102.8 | 105.3 | 76.3 | 80.9 | 101.3 | 97.6 |
| 2017 | 132.2 | 131.7 | 125.0 | 124.6 | 106.6 | 106.9 | 80.7 | 80.4 | 98.6 | 98.3 |
| 2018 | 131.1 | 131.8 | 121.3 | 124.9 | 109.5 | 108.5 | 79.9 | 79.8 | 96.5 | 99.0 |
Rates per 100,000 for Lung and Bronchus, Observed SEER Incidence, Female, 2006-2015, All Ages
| Year | White | White Modeled (from Joinpoint) | Black | Black Modeled (from Joinpoint) | Asian/Pacific Islander | Asian/Pacific Islander Modeled (from Joinpoint) | American Indian/Alaska Nativea | American Indian/Alaska Nativea Modeled (from Joinpoint) | Hispanicb | Hispanicb Modeled (from Joinpoint) |
|---|---|---|---|---|---|---|---|---|---|---|
| 2009 | 56.8 | 56.1 | 49.5 | 49.9 | 30.2 | 29.5 | 34.8 | 34.1 | 26.0 | 25.4 |
| 2010 | 54.6 | 55.3 | 50.1 | 48.9 | 28.0 | 29.4 | 34.2 | 34.2 | 24.6 | 25.0 |
| 2011 | 54.0 | 54.5 | 46.8 | 47.9 | 29.4 | 29.3 | 35.4 | 34.4 | 24.0 | 24.6 |
| 2012 | 53.4 | 53.7 | 47.3 | 46.9 | 29.6 | 29.2 | 34.5 | 34.6 | 23.3 | 24.2 |
| 2013 | 53.2 | 53.0 | 45.0 | 45.9 | 29.4 | 29.0 | 30.7 | 34.8 | 25.4 | 23.9 |
| 2014 | 52.0 | 52.2 | 45.8 | 45.0 | 28.6 | 28.9 | 31.5 | 34.9 | 22.8 | 23.5 |
| 2015 | 52.1 | 51.5 | 44.1 | 44.1 | 28.4 | 28.8 | 39.6 | 35.1 | 23.0 | 23.1 |
| 2016 | 51.3 | 50.7 | 43.1 | 43.1 | 28.8 | 28.7 | 38.0 | 35.3 | 23.9 | 22.8 |
| 2017 | 50.7 | 50.0 | 42.1 | 42.3 | 29.2 | 28.6 | 34.4 | 35.5 | 22.4 | 22.4 |
| 2018 | 48.1 | 49.3 | 41.5 | 41.4 | 28.3 | 28.5 | 34.3 | 35.6 | 21.5 | 22.1 |
Rates per 100,000 for Colon and Rectum, Observed SEER Incidence, Female, 2006-2015, All Ages
| Year | White | White Modeled (from Joinpoint) | Black | Black Modeled (from Joinpoint) | Asian/Pacific Islander | Asian/Pacific Islander Modeled (from Joinpoint) | American Indian/Alaska Nativea | American Indian/Alaska Nativea Modeled (from Joinpoint) | Hispanicb | Hispanicb Modeled (from Joinpoint) |
|---|---|---|---|---|---|---|---|---|---|---|
| 2009 | 38.2 | 38.1 | 46.5 | 45.9 | 32.5 | 32.0 | 36.1 | 35.1 | 31.7 | 30.6 |
| 2010 | 36.5 | 36.6 | 44.9 | 44.5 | 31.9 | 31.2 | 34.5 | 36.1 | 30.9 | 30.4 |
| 2011 | 35.4 | 35.2 | 42.6 | 43.2 | 30.4 | 30.3 | 38.8 | 37.0 | 30.0 | 30.2 |
| 2012 | 34.5 | 34.8 | 41.4 | 42.0 | 28.9 | 29.5 | 36.7 | 38.0 | 28.7 | 30.0 |
| 2013 | 33.9 | 34.3 | 39.9 | 40.8 | 27.1 | 28.7 | 37.7 | 39.1 | 28.0 | 29.8 |
| 2014 | 33.9 | 33.8 | 40.8 | 39.6 | 27.9 | 27.9 | 41.0 | 40.1 | 30.0 | 29.6 |
| 2015 | 33.8 | 33.4 | 37.7 | 38.4 | 27.2 | 27.1 | 38.9 | 38.7 | 29.6 | 29.4 |
| 2016 | 33.5 | 32.9 | 38.3 | 37.3 | 26.6 | 26.4 | 37.4 | 37.3 | 29.9 | 29.2 |
| 2017 | 32.5 | 32.5 | 35.6 | 36.2 | 26.8 | 25.7 | 36.7 | 36.0 | 31.0 | 29.0 |
| 2018 | 31.5 | 32.1 | 35.3 | 35.2 | 24.5 | 25.0 | 34.1 | 34.7 | 27.2 | 28.9 |
Footnotes:
Source: SEER 21 areas (San Francisco, Connecticut, Detroit, Hawaii, Iowa, New Mexico, Seattle, Utah, Atlanta, San Jose-Monterey, Los Angeles, Alaska Native Registry, Rural Georgia, California excluding SF/SJM/LA, Kentucky, Louisiana, New Jersey, Georgia excluding ATL/RG), Idaho, New York and Massachusetts. Rates are age-adjusted to the 2000 US Std Population (19 age groups - Census P25-1103). Regression lines are calculated using the Joinpoint Regression Program Version 4.9, March 2021, National Cancer Institute.
aIncidence rates for American Indian/Alaska Native (AI/AN) are based on the CHSDA(Contract Health Service Delivery Area) counties.
bHispanic is not mutually exclusive from whites, blacks, Asian/Pacific Islanders, and American Indians/Alaska Natives. Incidence data for Hispanics are based on NHIA and exclude cases from the Alaska Native Registry.
Page Navigation: << Previous Next >>
The information on this page is archived and provided for reference purposes only. Persons with disabilities having difficulty accessing information on this page may e-mail for assistance.