
The navigation below allows you to jump to any table or figure within the SEER Cancer Statistics Review.
- First select the CSR Section, then a Table/Figure from that section.
- Use the Submit button to view the table or figure. You will have options to download a printer-friendly version (PDF) or the data table (CSV) as well.
To learn more about the Cancer Statistics Review and the statistics presented in this report, refer to the About the CSR(PDF, 524KB) and Technical Notes(PDF, 752KB) pages.
Download and Print: Download Printer-friendly PDF Download data
Figure 16.3
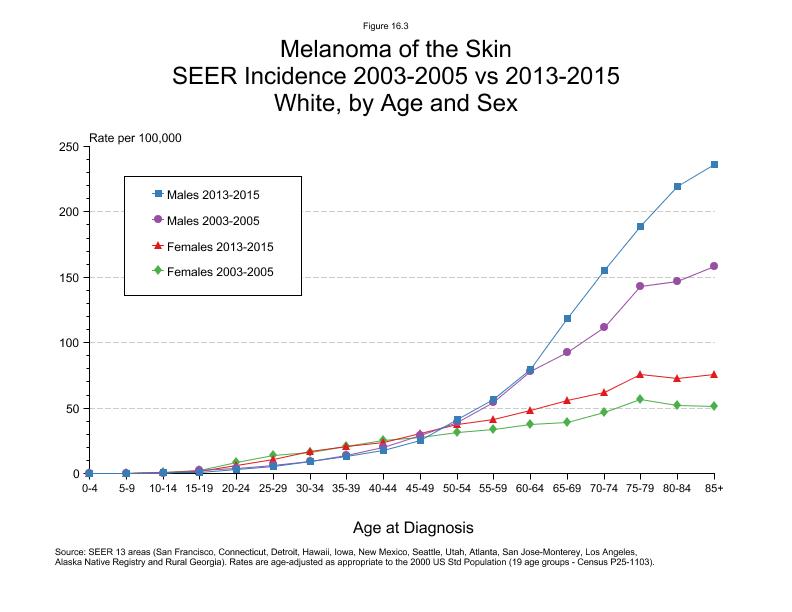
Figure 16.3
Melanoma of the Skin, SEER Incidence 2003-2005 vs 2013-2015 White, by Age and Sex
| Age at Diagnosis | Males, 2003-2005 Rate per 100,000 | Females, 2003-2005 Rate per 100,000 | Males, 2013-2015 Rate per 100,000 | Females, 2013-2015 Rate per 100,000 |
|---|---|---|---|---|
| Ages 0-4 | 0.2 | 0.1 | 0.1 | 0.1 |
| Ages 5-9 | 0.2 | 0.1 | 0.1 | 0.3 |
| Ages 10-14 | 0.4 | 0.6 | 0.5 | 0.4 |
| Ages 15-19 | 1.9 | 2.6 | 1.1 | 1.4 |
| Ages 20-24 | 3.8 | 8.1 | 2.7 | 5.9 |
| Ages 25-29 | 6.2 | 13.6 | 5.5 | 11.1 |
| Ages 30-34 | 9.4 | 16.1 | 9.2 | 17.1 |
| Ages 35-39 | 13.6 | 20.4 | 13.1 | 20.5 |
| Ages 40-44 | 19.8 | 25.1 | 17.6 | 24.0 |
| Ages 45-49 | 29.0 | 27.9 | 25.3 | 30.8 |
| Ages 50-54 | 38.9 | 31.4 | 41.0 | 37.6 |
| Ages 55-59 | 54.6 | 33.5 | 56.7 | 41.4 |
| Ages 60-64 | 77.7 | 37.1 | 79.6 | 48.0 |
| Ages 65-69 | 92.2 | 39.3 | 118.8 | 56.0 |
| Ages 70-74 | 111.5 | 47.0 | 155.5 | 62.1 |
| Ages 75-79 | 142.6 | 56.6 | 188.7 | 75.5 |
| Ages 80-84 | 146.4 | 51.7 | 219.3 | 72.8 |
| Ages 85+ | 158.0 | 51.5 | 236.0 | 75.8 |
Footnotes:
Source: SEER 13 areas (San Francisco, Connecticut, Detroit, Hawaii, Iowa, New Mexico, Seattle, Utah, Atlanta, San Jose-Monterey, Los Angeles, Alaska Native Registry and put Rural Georgia).
Rates are age-adjusted as appropriate to the 2000 US Std Population (19 age groups - Census P25-1103).
Page Navigation: << Previous Next >>
The information on this page is archived and provided for reference purposes only. Persons with disabilities having difficulty accessing information on this page may e-mail for assistance.