

Starting with the 1975-2017 SEER Data (November 2019 Submission), released on April 15, 2020, SEER no longer excludes Louisiana cancer cases in the research data or statistical reporting. All Louisiana cancer cases reported by the Louisiana Tumor Registry are included in the SEER 18 Research Data. Previous SEER 18 databases (November 2018 Submission and before) excluded 6 months of data from Louisiana (July-Dec 2005) for most types of analyses, and some analyses excluded all Louisiana cases because of issues with completeness of cases reported to the registry during the second half of 2005 related to Hurricane Katrina.
The main reason for this change is the fact that the Research databases no longer include geography (e.g. county, state or registry). Users are only able to conduct analyses with the aggregation of the SEER registries. The impact of including versus excluding Louisiana (July-Dec 2005) cancer cases in analyses combining all 18 SEER registries is negligible (see below).
The SEER Research Plus databases will include geography and will also include all Louisiana cancer cases diagnosed in 2005. Although the default analyses will be to include all the Louisiana cases, users have the ability to exclude all Louisiana cases or July-Dec 2005 Louisiana cases. Exclusion of Louisiana cases diagnosed between July-December 2005 may be important in incidence rates at the county or state level. The following section reports on the impact of excluding versus including Louisiana (July-Dec 2005) cancer cases in cancer incidence rates of Louisiana and all 18 SEER registries combined age-adjusted incidence rates for different cancer sites.
Impact of Including versus Excluding Louisiana (LA) Cases
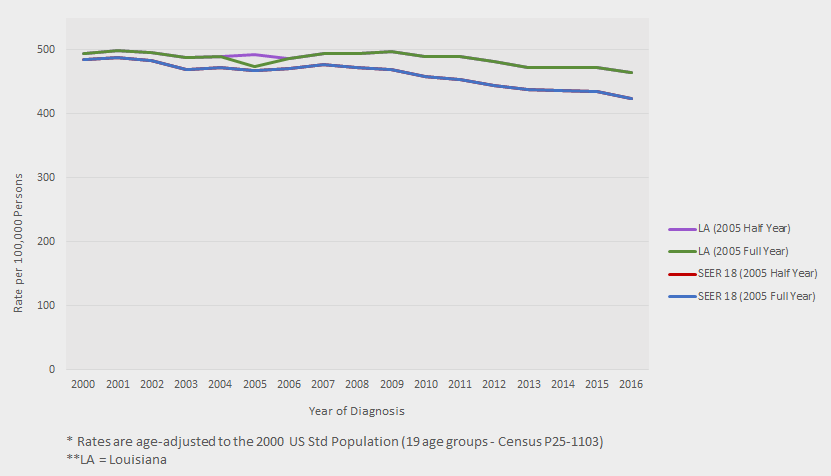
In the graph below, the lines representing SEER 18 rates that include 2005 half year (red) versus 2005 all year (blue) Louisiana cases completely overlap. These show that the rates do not change depending on whether Louisiana cases are excluded or included in rates using all SEER 18 registries combined. When looking at rates for just Louisiana, there is a notable impact for 2005 when calculating rates that include 2005 half year (purple) versus 2005 full year (green). Download Impact of Including versus Excluding Louisiana Cases in SEER Research Data (XLSX, 150 KB) to see graphs and associated rates for other cancer sites.
Katrina/Rita Population Adjustment
The U.S. populations included with the SEER data releases have been adjusted for the population shifts due to hurricanes Katrina and Rita for 62 counties and parishes in Alabama, Mississippi, Louisiana, and Texas (See U.S. Population Data for more information).
Once the populations were adjusted for the counties and parishes within the four states, the resulting total U.S. population was lower than the July 1 total U.S. population. The difference represents people displaced by the hurricanes who went to other parts of the U.S. A separate dummy state was introduced that represents these people. It is labeled ”Hurricane Katrina/Rita Evacuees - Populations Only - 2005” and is included by default in rate calculations over the total U.S.
Statistical Reporting with the Population Adjustment
Using SEER Incidence Data
Though each incidence database distributed with SEER*Stat for the November 2018 and earlier submissions includes "<Katrina/Rita Population Adjustment>" in the name, these adjustments are only applicable to the SEER 18 and SEER 21 Registries data, which include Louisiana.
Though "<Katrina/Rita Population Adjustment>" no longer appears in the SEER database names, starting with the November 2019 submission, these adjustments still apply to the SEER 18 and SEER 21 Registries data.
Using U.S. Mortality Data
When SEER reports on the total U.S., populations for the dummy state created to represent the evacuees,” Hurricane Katrina/Rita Evacuees - Populations Only - 2005”, are included in the analyses. Based on an analysis of Postal Service, ESRI data by the Los Angeles Times1, we know that the majority of those evacuees relocated to the following eight states: Texas, Arkansas, Louisiana, Mississippi, Alabama, Tennessee, Georgia, or Florida. When reported rates include those eight states, ”Hurricane Katrina/Rita Evacuees - Populations Only - 2005” are included in the analyses. If one or more of those states is excluded, then the evacuees are also excluded.
1 Where the Displaced Landed [Internet]. Los Angeles (CA): Los Angeles Times. 2005 Dec 12 [cited 2005 Dec 12]. Available from http://latimes.com
Adjustment in Previous Releases
Louisiana cases diagnosed for the second half of 2005 (July – December 2005) were excluded from SEER 18 databases through the 1975-2016 SEER Research Data (November 2018 Submission). However in those databases, July-December Louisiana cases were treated differently by session type:
- For prevalence calculations and incidence-based mortality databases, all Louisiana cases are excluded for all years by default.
- For multiple primary standardized incidence (and mortality) ratios, all Louisiana cases for all years are included.
- For all other sessions, including incidence rates, survival, left-truncated life tables, frequencies, and case listings, SEER excludes Louisiana cases diagnosed for the six month period, July-December 2005, by default.
