
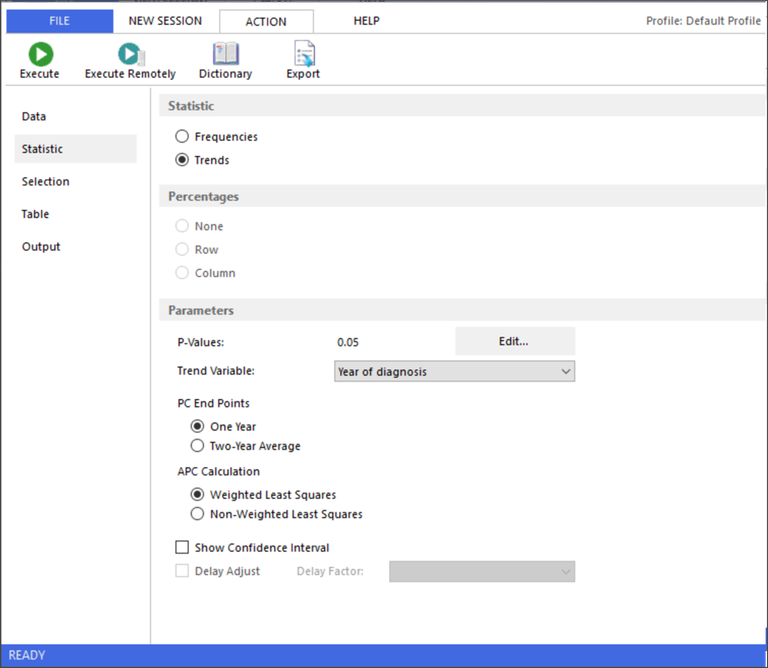
On the Statistic tab in a Frequency session (shown below), there are three sections:
- Statistic section - Select whether you want to calculate frequencies of cases, or trends of frequencies over time.
- Percentages section - Row or column percentages may be displayed in the results matrix.
- Parameters section - Edit the settings for p-values, trend variable, PC end points, APC calculation, and confidence intervals as needed.
Select the statistics and associated parameters appropriate for your session.

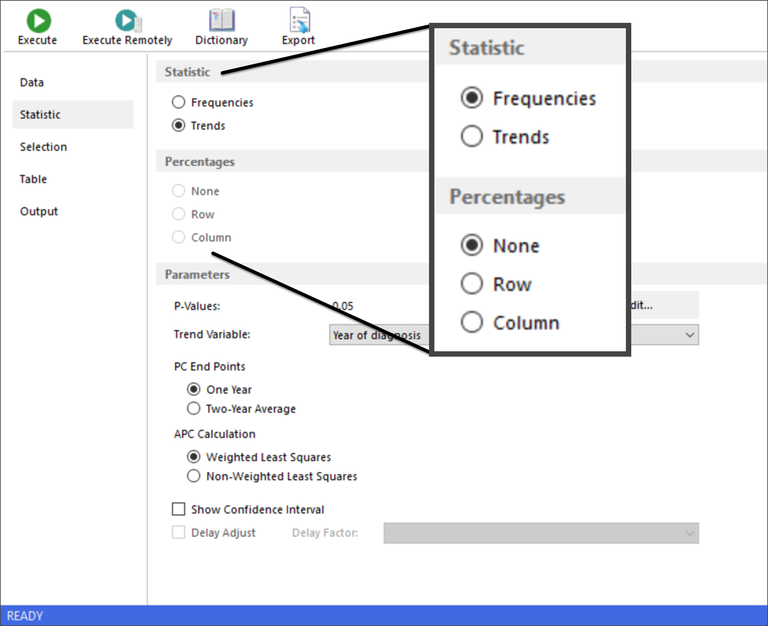
Statistic Section
In the Statistic section of the Statistic tab, you must choose to calculate either frequencies or trends of frequencies. Depending on your selection there will be different active sections on the tab. Any sections that do not apply to your selection will become inactive.
Frequencies are counts of records. (In the case of summarized records, such as in populations, the counts within the records are actually summed.) Row or column percentages may be calculated with frequencies. Only the Percentages section is active when the Frequencies radio button is selected. You can choose to include percentages in a row or column, or by selecting None eliminate. The Parameters section is inactive when you select Frequencies.

Trends are changes in counts over time. They are expressed in two forms: the percent change (PC) and the annual percent change (APC). When you select Trends, only the Parameters section of the Statistic tab is active.
- PC = ((end count - initial count) / initial count) * 100. One- or two-year counts can be used for the initial and end counts.
- The APC is calculated by fitting a regression line to the natural logarithm of the counts (c) using the calendar year (x) as a regressor variable, i.e., y = mx + b where y = ln(c). You may also utilize the standard errors of the counts to fit to a weighted least squares regression line.
Percentages Section
When calculating frequencies, you may choose to calculate row or column percentages. When either is requested, cumulative percentages are automatically included. The percentages and row or column totals are displayed in the output matrix.
It can be difficult to remember if you want to use column percentages or row percentages. Selecting Column Percentages will generate percentages of the row variables. As a rule of thumb, put your percentages in one dimension of the table and the variable in the other.
When table variables have overlapping groupings, an error message will notify you that the percentages cannot be calculated. Note that some variables provided with the software contain overlapping groupings.
For example, if you selected Sex as a column variable and chose to display row percentages, you would receive an error message because the group "Male and female” and the group "Male” both include the value "Male”. To correct this, create a user-defined variable that does not include the male and female grouping.
SEER*Stat cannot determine whether there are overlapping groupings in a merged variable; a warning message will remind you to check this yourself.
Parameters Section
P-Values
When calculating rates or trends, p-values are used in the calculation of confidence intervals and in significance testing. There are four p-values, one for each of the following calculations:
- Confidence intervals for rates
- Confidence intervals for APCs
- Significance testing of APCs to 0
- Significance testing of APCs to a base APC

In Frequency sessions p-values are only used when you select Trends on the Statistic tab. The initial default value for all p-values is 0.05. This is equivalent to a 95% confidence interval or 0.05 significance. To change the p-values, click the Edit button on the Statistic tab and the Level of Significance (P-values) dialog is displayed. You can change the values in the text boxes for Confidence Intervals and Significance Testing. The confidence intervals for rates and APCs are equal to 1 minus the p-value. The comparison between APCs to 0 or to APC is significant to the p-value.
Note: The p-value for Rate session confidence intervals can be edited in the same dialog box during a Frequency session, but is only used during a Rate session.
If you use a certain set of p-values regularly, you may want to set them as the defaults. To do so, enter the desired settings in the appropriate text boxes and click Set Default. The new p-values will be the defaults whenever you create a Frequency or Rate session. The Defaults button can be used at any time to reset the individual p-values to the current defaults.
Trend Variable
The trend variable defines the year ranges for which SEER*Stat computes the trends. Groupings that do not contain at least two consecutive years, or that contain non-contiguous years, will be ignored in trend calculations. Percent Change (PC) calculations with two-year average end points and Annual Percent Change (APC) calculations require at least three consecutive years. For each correctly defined grouping, SEER*Stat calculates the PC and the APC, and compares the APC to 0 for significance.
SEER*Stat also tests for significance in comparisons between APCs and a base APC. The first grouping listed in the dictionary's definition of the trend variable serves as the base APC. If a grouping has any years overlapping the base year grouping, this significance test cannot be performed.
If you wish to change the year groupings for your analysis, create a user-defined variable based on the standard trend variable for your database. For the SEER Limited-Use databases, the "Year of diagnosis" variable is the default trend variable.
The trend variable is automatically added as the innermost row variable of your results matrix, and therefore should not be added on the Table tab.
PC End Points
The formula for percent change (PC) is:
((end count - initial count) / initial count) * 100
On the Statistic tab in a Frequency session, you can set PC End Points to "One Year" or "Two-Year Average". If PC End Points is set to "One Year", then the initial count is the first year of the range and the end count is the last year. If PC End Points is set to "Two-Year Average", the software uses an average of the initial two years and last two years in the range for PC End Points.
APC Calculation
On the Statistic tabs in Frequency and Rate sessions, you have the option to use either the Weighted Least Squares or the Non-weighted Least Squares method to calculate Annual Percent Change (APC). Weighted APCs utilize the standard errors of the rates or counts in performing the log-linear regression, while non-weighted APCs do not.
Show Confidence Intervals
Check this box to calculate confidence intervals for the APCs. The degree of confidence is equal to one minus the p-value.
For example, a p-value equal to 0.05 yields 95% confidence intervals.
Delay Adjust
For some databases there is support provided for Delay Adjusting when calculating rates. For delay adjusting, check the Delay Adjust check box, and select the associated Delay Factor you wish to use in analysis. (For more information about Delay Adjusting see http://surveillance.cancer.gov/delay/.)
Delay Factor
For some databases there is support provided for Delay Adjusting when calculating rates. For delay adjusting, check the Delay Adjust check box, and select the associated Delay Factor you wish to use in analysis.