
CONCORD*Explorer
CONCORD*Explorer Help
CONCORD*Explorer is sn interactive tool providing statistics for the childhood cancers (ages 0-14 years) examined in the third cycle of the CONCORD program: brain tumors, acute lymphoblastic leukemias, and lymphomas. Data is available for each participating country by cancer site, sex, and calendar period of diagnosis.
The CONCORD*Explorer allows for direct comparison of one characteristic at a time (such as Sex) for selected groups. For example, you can compare 5-Year Survival by Calendar Period for Women.
Using CONCORD*Explorer
Quick Start Guide
The following steps provide an overview on how to use the CONCORD*Explorer application.
- Select a country using the Get the Started with a Country dropdown list.
- Select from the list, or in the first field of the list, begin typing a country to see the available options that match your term.
- Select a cancer site using the Choose a Cancer Site dropdown list.
- Select from the list or in the first field of the list begin typing a cancer site name to see the available sites that match your term.
- Select a graph type from those available by clicking on the tab.
- Some graphs are line graphs while others are bar graphs, depending on which is more appropriate to your selection.
- You can move from the Graph tab to the Data Table tab to see specific numbers.
- The graph and data table will automatically update as you make selections.
- Select a Compare By variable tab.
- The variable tab opens with the primary variable (the Compare By variable) at the top.
- You can select Sex, Calendar Period, or Country to compare by.
- Multiple variable values can be selected for the primary variable. For example, when comparing by sex you can select one or more of the choices which are Both Sexes (combined), Female, and Male.
- Sex, Calendar Period
- The variables not selected as the variable to Compare By are secondary variables.
- Select values for the secondary variables by clicking on the plus sign to open the dropdown lists and selecting a radio button next to the value you want to use.
- The secondary variables can only have one value at a time.
- Select a Graph or a Data Table by clicking on the tab.
- Some graphs are line graphs while others are bar graphs--depending on which is more appropriate for your selection.
- You can move from the Graph tab to the Data Table tab to see specific numbers.
- The graph and data table will automatically update as you make selections.
Interface Details
An overview of the CONCORD*Explorer interface.
User Controls
- Get Started with a Country
- Choose a Cancer Site
- Graph Type
See definitions by clicking on the question mark. - Compare By tabs
- Compare By variable values
Select more than one value to have a comparison. - Secondary variables
Select only one value from each variable. - More Options – See More Options section for details.
Results
- Selection Tabs
- Graph
- Legend
- Footnotes
- Data Table
The data table may have choices. If so, you can change your selection using the radio buttons.
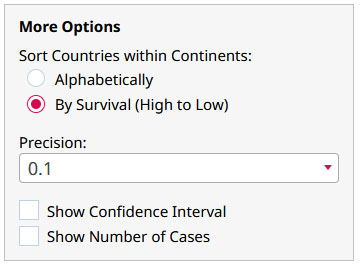
More Options
The controls available under More Options are dependent on the statistic. All of the possible controls that can appear in More Options
- Sort Countries within Continents – Choose to sort countries alphabetically or by survival (high to low).
- Precision – The number of decimal places shown in the table for Annual Percent Change (APC) or Rates may be specified here. You can set the value to 0.1, 0.01, 0.001 or 0.0001.
- Show Confidence Interval – When this option is checked, the confidence intervals (CI) will be displayed in the data tables as columns for C.I. Low and C.I. High. The values will also be displayed if you hover over a data point on the graph.
- Number of Cases – When this option is checked, the cases count will be displayed in the data tables as columns. The values will also be displayed if you hover over a data point on the graph.
Available Statistics
Net survival is the cumulative probability of surviving up to a given time since diagnosis, e.g., 5 years, after correcting for other causes of death (background mortality). Net survival is estimated with the Pohar Perme estimator, an unbiased estimator that takes account of the higher competing risk of death in elderly patients.
To control for the wide differences in background mortality between countries, territories and over time, we have constructed a library of over 16,000 life tables of all-cause mortality rates for each calendar year during 2000-2014, in the general population of each participating country or registry territory, by single year of age, sex, and race/ethnicity (Israel, Malaysia, New Zealand and Singapore). For the United States, the life tables are by sex, race/ethnicity (Whites, Blacks and others), state and county of residence.
Countries
CONCORD-3 analyzed data from 322 population-based cancer registries in 71 countries.
- Algeria
- Argentina
- Australia
- Austria
- Belarus
- Belgium
- Brazil
- Bulgaria
- Canada
- Chile
- China
- Colombia
- Costa Rica
- Croatia
- Cuba
- Cyprus
- Czech Republic
- Denmark
- Ecuador
- Estonia
- Finland
- France
- Germany
- Greece
- Gibraltar
- Guadeloupe
- Hong Kong
- Iceland
- India
- Iran
- Ireland
- Israel
- Italy
- Japan
- Jordan
- Kuwait
- Latvia
- Lithuania
- Malaysia
- Mali
- Malta
- Martinique
- Mauritius
- Mexico
- Mongolia
- Morocco
- Netherlands
- New Zealand
- Nigeria
- Norway
- Peru
- Poland
- Portugal
- Puerto Rico
- Qatar
- Romania
- Russian Federation
- Slovakia
- Slovenia
- Spain
- Sweden
- Switzerland
- Singapore
- South Africa
- South Korea
- Taiwan
- Thailand
- Türkiye
- United Kingdom
- United States
- Uruguay
Definitions
-
Confidence Interval
A range of values that have a specified probability (often 95%) of containing the true value of a given parameter, such as a survival estimate, an incidence rate, or a trend.
-
Age-standardized Net Survival
Cancer survival varies with age at diagnosis. For most cancers, it is lower in older patients. The proportion of cancer patients who are younger or older – their age profile – differs between cancers, between countries or regions, and over time. Age-standardization produces a weighted average of the survival figures for each separate age group. The same weights are used to produce the age-standardized survival for every country.
With age-standardization we avoid the mistake of concluding that there are international differences in cancer survival, or in survival trends, when the differences that we see could be due solely to international differences in the age profile of cancer patients, or changes in the age profile of patients within a country. The use of age-standardized estimates enables fair comparison of cancer survival estimates for a given cancer between countries and territories and over time.
Where age-standardization was not possible, usually because too few patients were available for analysis of survival in each age group, the survival estimates are flagged in the tables and graphics, to aid interpretation.
Frequently Asked Questions
-
Are the cancer survival figures from all these countries truly comparable?
CONCORD-3 is not a compilation of survival estimates that have been published by various cancer registries, using different data definitions, quality control and analytic methods. Such results cannot be directly compared.
CONCORD-3 is a systematic analysis of over 37 million anonymized individual cancer patient records in over 4,700 data sets, using a tight protocol, standardized quality control and centralized analysis with cutting-edge methods.
No study is perfect, and a study of this size will always have weaknesses. We believe the results are nevertheless comparable, within the limits of data quality.
We have flagged survival figures that may be considered less reliable for international comparison, to help interpretation. We do this when we have to exclude more patients than expected from the survival analyses, usually because their date of diagnosis or death was not accurately known, or because some deaths may not have been recorded.
We conducted extensive quality control of the data, in three phases. Standardized reports were sent to each cancer registry after each phase. Many data sets had very few significant errors, or even none. Where problems were identified, however, we liaised with the registry concerned in Chinese, Croatian, English, French, Italian, Portuguese or Spanish, as required, to discuss errors and to request correction of data where necessary.
-
Some countries are very small: are their survival figures reliable?
Survival estimates based on small numbers of patients are less precise than estimates based on large numbers of patients. This is intuitively obvious, and it is reflected in the 95% confidence interval around each survival estimate. Thus, the confidence intervals for survival estimates from Gibraltar (population 32,000) are much wider than for survival estimates from Belgium (population 11 million).
However, precision is not the same as accuracy. Survival estimates are not necessarily right (accurate, or reliable) just because they are based on large numbers of patients and are statistically precise (narrow confidence interval). Complete registration and follow-up of cancer patients may be hard to achieve in big cities.
Equally, survival estimates are not necessarily wrong (inaccurate, or unreliable) just because they are based on small numbers of patients (wide confidence interval). It can be easier to achieve complete, high-quality registration and follow-up of all cancer patients in small populations or islands.
International comparisons of cancer survival should be interpreted in the light of data quality measures. We have indicated where the reliability of the survival estimates is affected by data quality. We have also provided the statistical precision of each estimate, with 95% confidence intervals for every survival estimate in tables and graphics.
-
Where do I go for Technical Support?
Please send questions or comments to CONCORD*Explorer Support.
-
Where do I go for questions about CONCORD statistics?
Please email questions or comments to concord@lshtm.ac.uk, with the subject line "CONCORD*Explorer".