
SEER*Explorer
SEER*Explorer Help
SEER*Explorer is an interactive tool for quick access to a wide range of SEER cancer statistics organized by cancer site and by demographic characteristics such as sex, race/ethnicity, age, and calendar year. A select number of cancer sites may also be viewed by stage at diagnosis. Statistics may be viewed as graphs or tables and downloaded for use in other programs.
The SEER*Explorer allows for direct comparison of one characteristic at a time (such as Race/Ethnicity or Sex) for selected groups. For example, you can compare Recent Trends of Lung Cancer Incidence by Race/Ethnicity for Women.
Watch a Quick Overview
Using SEER*Explorer
Quick Start Guide
The following steps provide an overview on how to use the SEER*Explorer application.
- Select a cancer site using the Get Started with a Cancer Site dropdown list.
- Select from the list or in the first field of the list begin typing a cancer site name to see the available sites that match your term.
- The selection of cancer sites determines the data available. For example, Thyroid: Papillary subtype only has three types of data available; SEER Incidence, Survival and Prevalence. Other cancer sites have up to five data types available.
- If you would like to compare multiple cancer sites on the same graph, select the Compare Cancer Sites option.
- Select a data type using the Choose a Statistic to Explore dropdown list.
- The data types in the dropdown list depend on the availability of the data for the cancer site selected.
- The data type you select also determines the type of graphs available. For example SEER Incidence allows you to select Recent Trends, Recent Rates, Long-Term Trends, and Rates by Age; while Prevalence allows you to select Complete and Limited Duration.
- Select a graph type from those available by clicking on the tab.
- Some graphs are line graphs while others are bar graphs depending on which is more appropriate to your selection.
- You can move from the Graph tab to the Data Table tab to see specific numbers.
- The graph and data table will automatically update as you make selections.
- Select a Compare By variable tab.
- The variable tab opens with the primary variable (the Compare By variable) at the top.
- You can select Sex, Race/Ethnicity, Age, or Stage at Diagnosis to compare by.
- Multiple variable values can be selected for the primary variable. For example, when comparing by sex you can select one or more of the choices which are Both Sexes (combined), Female, and Male.
- Sex, Race/Ethnicity, Age, Stage at Diagnosis
- The variables not selected as the variable to Compare By are secondary variables.
- Select values for the secondary variables by clicking on the plus sign to open the dropdown lists and selecting a radio button next to value you want to use.
- The secondary variables can only have one value at a time.
Interface Details

An overview of the Seer*Explorer interface.
User Controls
- Get Started with a Cancer Site
- Choose a Statistic to Explore
This includes SEER Incidence, U.S. Mortality, Survival, Prevalence, and Risk of Diagnoses/Dying. See definitions by clicking on the question mark. - Graph Type
See definitions by clicking on the question mark. - Compare By tabs
- Compare By variable values
Select more than one value to have a comparison. - Secondary variables
Select only one value from each variable. - More Options – See More Options section for details.
Results
- Selection Tabs
- View APC
Toggle a panel to view the Annual Percent Change (APC) estimates for a series displayed on the graph.
Available for Recent Trends and Long-Term Trends - Graph
- Legend
- Foot Notes
- Data Table
The data table may have choices. If so you can change your selection using the radio buttons.
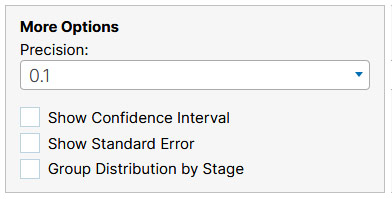
More Options
The controls available under More Options are dependent on the statistic. All of the possible controls that can appear in More Options:
- Precision – The number of decimal places shown in the table for Annual Percent Change (APC) or Rates may be specified here. You can set the value to 0.1, 0.01, 0.001, or 0.0001.
- Show Standard Error – When this option is checked, Standard Errors will be displayed in the data table and will also be displayed if you hover over a data point on the graph.
- Show Confidence Interval – When this option is checked, the confidence intervals (CI) will be displayed in the data tables as columns for C.I. Low and C.I. High. The values will also be displayed if you hover over a data point on the graph.
- Group Distribution by Stage – This option is available when the Stage Distribution tab is selected. When this option is checked, the graph will be to show the Stage variable as the legend variable, by default, the stage variable is the x-axis variable on the graph.
Available Statistics
SEER Incidence and U.S. Mortality
SEER Incidence is the number of new cases of the specific cancer site/type per 100,000 people in the U.S. Number of new cases per number of people in a population are also referred to as incidence rates.
Cancer Mortality is the number of deaths caused by a specific cancer site/type per 100,000 people in the U.S. Number of deaths per number of people in a population are also referred to as mortality rates.
-
Recent Trends
Recent trends present the observed (points) and predicted (lines) annual age-adjusted rates and corresponding annual percent change (APC) trend for each joinpoint segment in the table. Predicted are estimated using the joinpoint software. Recent trends are available from 2000 through the current year of available data.
-
Recent Rates
Recent rates present the age-adjusted rate for the aggregated five most recent years of the available data, in a bar chart format.
-
Long-Term Trends
Long-term trends present the annual age-adjusted observed (points) and predicted (lines) rates and corresponding annual percent change (APC) trend for each joinpoint segment in the table. Predicted are estimated using the joinpoint software. Long-term trends are available from 1975 through the current year of available data.
-
Rates by Age
Rates by age refer to a rate for a specified age group for the most recent 5-year time period. SEER provides data for 19 separate age groups. Rates by age are also referred to as age-specific rates.
-
Stage Distribution (Incidence Only)
Stage distributions show the distribution of incidence cases by stage at diagnosis (Localized, Regional, Distant, or Unstaged).
-
Median Age
The median age at diagnosis/death is the age at which half of all reported cases were older and half were younger.
-
Rural/Urban Trends
Rural/Urban trends present recent trend estimates stratified by rural/urban county status. Rural and Urban groupings are defined using time-dependent Rural-Urban Continuum Codes (RUCC), which distinguish metropolitan (Urban) counties from nonmetropolitan (Rural) counties based on evolving delineations over time.
-
Rural/Urban Rates
Rural/Urban rates present the age-adjusted rate for the aggregated five most recent years of the available data, stratified by rural/urban county status.
Survival
Relative survival is an estimate of the percentage of patients who would be expected to survive the effects of their cancer. It excludes the risk of dying from other causes. Relative Survival statistics compare the survival of patients diagnosed with cancer with the survival of people in the general population who are the same age, race, and sex and who have not been diagnosed with cancer.
-
Recent Trends
Recent trends present observed (points) and predicted (lines) relative survival by time since diagnosis (one year, three years, five years) and corresponding trend shown in the table. The trend measure is the average absolute change in relative survival (AACS) by diagnosis year. The values represent the difference in the percent surviving from one calendar year at diagnosis to the previous. For example, an AACS=1.0 represents that on average survival for patients diagnosed in a calendar year is higher 1% survival points compared to patients diagnosed in the previous year. The recent trends for survival are available from 2000 through the current year of data and are available by Survival Time (one year, three years, five years).
-
5-year Survival
5-year relative survival rates show the estimated percentage of patients who would be expected to survive the effects of their cancer five years or more after cancer diagnosis. It excludes the risk of dying from other. Patients diagnosed over a seven year period are included to allow enough follow-up time for an accurate measure of 5-year survival.
-
By Time Since Diagnosis
Survival by time since diagnosis provides a view of the percentage of people surviving by year after diagnosis up to ten years.
Prevalence
Cancer Prevalence is the number or percent of people alive on a certain date who have been diagnosed with cancer. In Prevalence we show complete prevalence (people alive ever diagnosed with cancer) and limited-duration prevalence (people diagnosed in the x years prior to the prevalence date).
-
Complete
Complete prevalence represents the proportion of people alive on a certain day who previously had a diagnosis of the disease, regardless of how long ago the diagnosis was, or whether the patient is still under treatment or is considered cured. Complete prevalence is presented as U.S. counts or percent for all races combined by age and sex.
-
Limited Duration
Limited-duration prevalence represents the proportion of people alive on a certain day who had a diagnosis of the disease within the past 25 years. Limited duration prevalence is presented as U.S. counts, or age-adjusted percent of the U.S. population by age, sex, race and time since diagnosis.
Risk of Developing/Dying
Lifetime risk is usually given as the likelihood that a person who is free of a certain type of cancer will develop or die from that type of cancer during his or her lifetime.
-
Risk Intervals
The risk intervals present the risk of developing or dying from cancer for those born cancer-free. The last point in the series is the Remaining Life and represents the lifetime risk from birth, using the expected number of years of the U.S. population in xxx to xxx.
-
Risk Comparisons
Lifetime risk estimates are presented as bar charts by the Type of Risk, Sex, Race/Ethnicity, Starting Age, and the length of the interval to examine. The risk estimates for these available groups can be compared individually or against another group.
Definitions
- Age-Adjusted Rate
A method allowing comparisons of populations that takes into account age-distribution differences between populations. - Annual Percent Change
Used to measure trends or the change in rates over time. - APC/Rate Precision
The number of decimal places shown in the data table. - Cancer Sites
Refer to the SEER*Explorer Cancer Site Definitions for more information - Confidence Interval
A range of values that have a specified probability of containing the rate or trend.
- P-Value
Used in the calculation of confidence intervals and in significance testing. The default value for all p-values is 0.05 (equivalent to a 95% confidence interval or 0.05 significance). - Stage at Diagnosis
The stage that the cancer has progressed to at the time of diagnosis.- Localized: Confined to the Primary Site
- Regional: Spread to Regional Lymph Nodes
- Distant: Cancer Has Metastasized
- Unstaged: Unknown (or Not Enough Information to Indicate a Stage)
- Standard Error
The standard error of an estimate is a measure of the sampling variability of the estimate.
Frequently Asked Questions
-
How do I do cross-comparisons of multiple characteristics, for example Race and Sex?
For certain statistics including recent trends in incidence and mortality rates, 5-year survival, prevalence estimates, and cancer risk comparisons, you can compare multiple characteristics. When the option is available, use the "Additional Comparison" drop down menu in the Compare By section to compare options such as Race/Ethnicity to Sex or Age.For other statistics types or more complex cross comparisons, you can download the data in CSV format to be used with other software like Microsoft Excel.
-
How do I compare multiple types of cancer?
In the Get Started with a Cancer Site drop down, please select the option to "Compare Cancer Sites". This selection will enable a button in the Compare By section to allow you to select multiple cancer sites for comparison. -
How do I find data for previous releases?
An archive of the data used in SEER*Explorer, organized by SEER data submission year and broken down by cancer statistic, can be found on the Data Archive page. -
Where do I go for Technical Support?
Please send questions or comments to SEER Website Support.