

Statistics at a Glance
At a Glance
Estimated New Cases in 2026 79,320
% of All New Cancer Cases 3.8%
Estimated Deaths in 2026 19,970
% of All Cancer Deaths 3.2%
5-Year
Relative Survival
| Year | Rate of New Cases — SEER 8 | Rate of New Cases — SEER 12 | Death Rate — U.S. | 5-Year Relative Survival — SEER 8 | ||||
|---|---|---|---|---|---|---|---|---|
| Observed | Modeled Trend | Observed | Modeled Trend | Observed | Modeled Trend | Observed | Modeled Trend | |
| 1975 | 11.02 | 10.76 | - | - | 5.62 | 5.49 | 46.64% | 47.98% |
| 1976 | 11.44 | 11.15 | - | - | 5.71 | 5.63 | 48.21% | 48.65% |
| 1977 | 11.36 | 11.56 | - | - | 5.76 | 5.77 | 45.28% | 49.31% |
| 1978 | 11.57 | 11.98 | - | - | 5.92 | 5.91 | 48.08% | 49.97% |
| 1979 | 12.69 | 12.41 | - | - | 5.94 | 6.05 | 47.84% | 50.63% |
| 1980 | 12.57 | 12.86 | - | - | 6.22 | 6.20 | 49.06% | 51.28% |
| 1981 | 13.77 | 13.33 | - | - | 6.16 | 6.36 | 50.84% | 51.93% |
| 1982 | 13.12 | 13.81 | - | - | 6.54 | 6.51 | 50.73% | 52.58% |
| 1983 | 13.79 | 14.31 | - | - | 6.65 | 6.67 | 52.54% | 53.22% |
| 1984 | 15.11 | 14.83 | - | - | 6.76 | 6.84 | 52.46% | 53.09% |
| 1985 | 15.40 | 15.37 | - | - | 7.05 | 7.01 | 53.12% | 52.95% |
| 1986 | 16.11 | 15.92 | - | - | 7.30 | 7.18 | 51.35% | 52.82% |
| 1987 | 16.79 | 16.50 | - | - | 7.26 | 7.36 | 52.62% | 52.68% |
| 1988 | 17.36 | 17.10 | - | - | 7.52 | 7.54 | 50.83% | 52.55% |
| 1989 | 17.49 | 17.72 | - | - | 7.82 | 7.73 | 49.86% | 52.41% |
| 1990 | 18.53 | 18.36 | - | - | 7.87 | 7.92 | 50.15% | 52.28% |
| 1991 | 18.69 | 19.02 | - | - | 8.19 | 8.11 | 51.10% | 52.14% |
| 1992 | 18.88 | 19.14 | 18.70 | 18.99 | 8.22 | 8.24 | 51.01% | 52.01% |
| 1993 | 19.06 | 19.26 | 18.63 | 19.07 | 8.24 | 8.37 | 53.41% | 51.87% |
| 1994 | 19.99 | 19.38 | 19.55 | 19.16 | 8.63 | 8.51 | 52.76% | 51.73% |
| 1995 | 20.17 | 19.50 | 19.86 | 19.24 | 8.72 | 8.64 | 52.94% | 54.18% |
| 1996 | 19.45 | 19.62 | 19.47 | 19.33 | 8.75 | 8.78 | 56.76% | 56.56% |
| 1997 | 19.81 | 19.74 | 19.32 | 19.42 | 8.88 | 8.92 | 60.65% | 58.86% |
| 1998 | 19.70 | 19.86 | 19.40 | 19.50 | 8.68 | 8.65 | 61.44% | 61.09% |
| 1999 | 19.93 | 19.98 | 19.78 | 19.59 | 8.32 | 8.38 | 63.31% | 63.23% |
| 2000 | 19.59 | 20.11 | 19.24 | 19.68 | 8.16 | 8.12 | 64.65% | 65.30% |
| 2001 | 19.95 | 20.23 | 19.63 | 19.77 | 7.90 | 7.87 | 66.85% | 67.28% |
| 2002 | 20.22 | 20.35 | 19.69 | 19.86 | 7.65 | 7.63 | 70.51% | 69.17% |
| 2003 | 20.38 | 20.48 | 19.95 | 19.95 | 7.38 | 7.40 | 70.68% | 69.81% |
| 2004 | 21.10 | 20.61 | 20.55 | 20.04 | 7.09 | 7.17 | 70.87% | 70.44% |
| 2005 | 20.79 | 20.73 | 20.07 | 20.13 | 6.95 | 6.95 | 72.45% | 71.06% |
| 2006 | 20.37 | 20.86 | 20.00 | 20.22 | 6.74 | 6.74 | 71.29% | 71.67% |
| 2007 | 21.24 | 20.99 | 20.39 | 20.31 | 6.59 | 6.53 | 72.31% | 72.26% |
| 2008 | 20.97 | 20.86 | 20.32 | 20.40 | 6.41 | 6.41 | 73.60% | 72.85% |
| 2009 | 20.84 | 20.72 | 20.57 | 20.28 | 6.29 | 6.29 | 75.30% | 73.43% |
| 2010 | 20.97 | 20.59 | 20.54 | 20.15 | 6.14 | 6.17 | 75.09% | 74.00% |
| 2011 | 19.61 | 20.46 | 19.23 | 20.03 | 6.05 | 6.05 | 74.91% | 74.56% |
| 2012 | 20.44 | 20.33 | 19.65 | 19.91 | 5.96 | 5.93 | 76.02% | 75.10% |
| 2013 | 19.65 | 20.20 | 19.39 | 19.79 | 5.77 | 5.82 | 76.50% | 75.64% |
| 2014 | 20.52 | 20.07 | 20.10 | 19.67 | 5.74 | 5.71 | 76.75% | 76.17% |
| 2015 | 20.17 | 19.95 | 19.68 | 19.55 | 5.57 | 5.60 | 78.40% | 76.69% |
| 2016 | 19.73 | 19.82 | 19.44 | 19.43 | 5.49 | 5.50 | 78.20% | 77.20% |
| 2017 | 19.84 | 19.69 | 19.24 | 19.32 | 5.44 | 5.39 | 78.09% | 77.70% |
| 2018 | 19.81 | 19.57 | 19.47 | 19.20 | 5.28 | 5.29 | 77.93% | 76.90% |
| 2019 | 19.70 | 19.44 | 19.52 | 19.08 | 5.18 | 5.19 | - | 76.08% |
| 2020 | 18.33 | 19.32 | 18.10 | 18.97 | 5.04 | 5.05 | - | 75.24% |
| 2021 | 19.61 | 19.20 | 19.02 | 18.85 | 4.94 | 4.91 | - | 74.37% |
| 2022 | 18.88 | 19.08 | 18.52 | 18.74 | 4.76 | 4.77 | - | 73.48% |
| 2023 | 18.37 | 18.95 | 18.29 | 18.63 | 4.68 | 4.64 | - | 72.56% |
| 2024 | - | - | - | - | 4.48 | 4.51 | - | - |
New cases come from SEER 12. Deaths come from U.S. Mortality.
All Races, Both Sexes. Rates are Age-Adjusted.
Modeled trend lines were calculated from the underlying rates using the Joinpoint Trend Analysis Software.
The 2020 incidence rate is displayed but not used in the fit of the trend line(s). Impact of COVID on SEER Cancer Incidence 2020 data
New cases are also referred to as incident cases in other publications. Rates of new cases are also referred to as incidence rates.
Rate of New Cases and Deaths per 100,000: The rate of new cases of non-Hodgkin lymphoma was 18.7 per 100,000 men and women per year. The death rate was 4.8 per 100,000 men and women per year. These rates are age-adjusted and based on 2019–2023 cases and 2020–2024 deaths.
Lifetime Risk of Developing Cancer: Approximately 2.0 percent of men and women will be diagnosed with non-Hodgkin lymphoma at some point during their lifetime, based on 2021–2023 data.
Prevalence of This Cancer: In 2023, there were an estimated 872,940 people living with non-Hodgkin lymphoma in the United States.
Survival Statistics
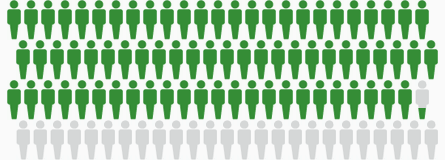
How Many People Survive 5 Years Or More after Being Diagnosed with Non-Hodgkin Lymphoma?
Relative survival is an estimate of the percentage of patients who would be expected to survive the effects of their cancer. It excludes the risk of dying from other causes. Because survival statistics are based on large groups of people, they cannot be used to predict exactly what will happen to an individual patient. No two patients are entirely alike, and treatment and responses to treatment can vary greatly.
5-Year
Relative Survival
Based on data from SEER 21 (Excluding IL) 2016–2022. Gray figures represent those who have died from non-Hodgkin lymphoma. Green figures represent those who have survived 5 years or more.
Survival by Stage
Cancer stage at diagnosis, which refers to extent of a cancer in the body, determines treatment options and has a strong influence on the length of survival. The earlier non-Hodgkin lymphoma is caught, the better chance a person has of surviving five years after being diagnosed. For non-Hodgkin lymphoma, 21.0% are diagnosed at stage I. The 5-year relative survival for stage I non-Hodgkin lymphoma is 87.6%.
| Stage | Percent of Cases | 5-Year Relative Survival |
|---|---|---|
| Stage I Confined to Single Region |
21% | 87.6% |
| Stage II Involving Mulitple Regions |
15% | 79.7% |
| Stage III Spread to Both Sides of Diaphragm |
17% | 74.0% |
| Stage IV Diffuse or Disseminated Involvement |
37% | 63.6% |
| Unknown Unstaged |
10% | 71.9% |
 Stage I (21%)
SEER 17 2016–2022, All Races, Both Sexes by Ann Arbor Stage.
Statistics by stage only include cases coded as Lymhpoma or Lymphoma-CLL/SLL in EOD 2018 schema definitions.
New Cases and Deaths
How Common Is This Cancer?
Compared to other cancers, non-Hodgkin lymphoma is fairly common.
| Rank | Common Types of Cancer | Estimated New Cases 2026 |
Estimated Deaths 2026 |
|---|---|---|---|
| 1. | Prostate Cancer | 333,830 | 36,320 |
| 2. | Breast Cancer (Female) | 321,910 | 42,140 |
| 3. | Lung and Bronchus Cancer | 229,410 | 124,990 |
| 4. | Colorectal Cancer | 158,850 | 55,230 |
| 5. | Melanoma of the Skin | 112,000 | 8,510 |
| 6. | Bladder Cancer | 84,530 | 17,870 |
| 7. | Kidney and Renal Pelvis Cancer | 80,450 | 15,160 |
| 8. | Non-Hodgkin Lymphoma | 79,320 | 19,970 |
| 9. | Uterine Cancer | 68,270 | 14,450 |
| 10. | Leukemia | 67,790 | 23,910 |
Non-Hodgkin lymphoma represents 3.8% of all new cancer cases in the U.S.

3.8%
In 2026, it is estimated that there will be 79,320 new cases of non-Hodgkin lymphoma and an estimated 19,970 people will die of this disease.
Who Gets This Cancer?
Non-Hodgkin lymphoma is more common in men than women, and among non-Hispanic Whites. The rate of new cases of non-Hodgkin lymphoma was 18.7 per 100,000 men and women per year based on 2019–2023 cases, age-adjusted.
Males
| All Races | 22.4 |
|---|---|
| Hispanic | 20.5 |
| Non-Hispanic American Indian/Alaska Native | 17.6 |
| Non-Hispanic Asian/Pacific Islander | 16.7 |
| Non-Hispanic Black | 16.9 |
| Non-Hispanic White | 24.2 |
Females
| All Races | 15.6 |
|---|---|
| Hispanic | 15.8 |
| Non-Hispanic American Indian/Alaska Native | 12.6 |
| Non-Hispanic Asian/Pacific Islander | 11.7 |
| Non-Hispanic Black | 11.9 |
| Non-Hispanic White | 16.5 |


SEER 21 2019–2023, Age-Adjusted
| Age Range | Percent of New Cases |
|---|---|
| <20 | 1.6% |
| 20–34 | 3.6% |
| 35–44 | 4.8% |
| 45–54 | 9.5% |
| 55–64 | 20.0% |
| 65–74 | 28.7% |
| 75–84 | 23.0% |
| >84 | 8.8% |
Non-Hodgkin lymphoma is most frequently diagnosed among people aged 65–74.
Median Age
At Diagnosis
SEER 21 2019–2023, All Races, Both Sexes
Who Dies From This Cancer?
Non-Hodgkin lymphoma is the eighth leading cause of cancer death in the United States. The death rate was 4.8 per 100,000 men and women per year based on 2020–2024 deaths, age-adjusted.
Males
| All Races | 6.2 |
|---|---|
| Hispanic | 5.2 |
| Non-Hispanic American Indian/Alaska Native | 5.7 |
| Non-Hispanic Asian/Pacific Islander | 4.4 |
| Non-Hispanic Black | 4.6 |
| Non-Hispanic White | 6.6 |
Females
| All Races | 3.6 |
|---|---|
| Hispanic | 3.4 |
| Non-Hispanic American Indian/Alaska Native | 3.2 |
| Non-Hispanic Asian/Pacific Islander | 2.7 |
| Non-Hispanic Black | 2.6 |
| Non-Hispanic White | 3.8 |
U.S. 2020–2024, Age-Adjusted
| Age Range | Percent of Deaths |
|---|---|
| <20 | 0.2% |
| 20–34 | 0.9% |
| 35–44 | 1.6% |
| 45–54 | 3.8% |
| 55–64 | 11.7% |
| 65–74 | 25.2% |
| 75–84 | 33.9% |
| >84 | 22.6% |
The percent of non-Hodgkin lymphoma deaths is highest among people aged 75–84.
Median Age
At Death
U.S. 2020–2024, All Races, Both Sexes
Trends in Rates
Changes Over Time
Keeping track of new cases, deaths, and survival over time (trends) can help scientists understand whether progress is being made and where additional research is needed to address challenges, such as improving screening or finding better treatments.
Using statistical models for analysis, age-adjusted rates for new non-Hodgkin lymphoma cases have been falling on average 0.6% each year over 2014–2023. Age-adjusted death rates have been falling on average 2.4% each year over 2015–2024. 5-year relative survival trends are shown below.
Interactive Statistics with SEER*Explorer
- Create custom graphs and tables
- Download data and images
- Share links to results
SEER*Explorer is an interactive website that provides easy access to a wide range of SEER cancer statistics. It provides detailed statistics for a cancer site by sex, race, calendar year, age, and for a selected number of cancer sites, by stage and histology.
Explore Additional Non-Hodgkin Lymphoma StatisticsMore About This Cancer
Non-Hodgkin Lymphoma
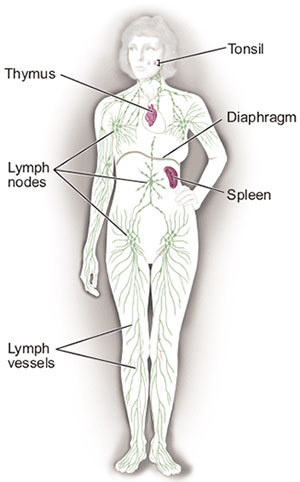
Figure: This picture shows lymph nodes above and below the diaphragm. It also shows the lymph vessels, tonsils, thymus, and spleen.
Lymphoma is cancer that begins in cells of the lymph system. The lymph system is part of the immune system, which helps the body fight infection and disease. Because lymph tissue is found all through the body, lymphoma can begin almost anywhere.
The two main types of lymphoma are Hodgkin lymphoma and non-Hodgkin lymphoma (NHL). These can occur in both children and adults.
There are many different types of NHL that form from different types of white blood cells (B-cells, T-cells, NK cells). Most types of NHL form from B-cells. NHL may be indolent (slow-growing) or aggressive (fast-growing). The most common types of NHL in adults are diffuse large B-cell lymphoma, which is usually aggressive, and follicular lymphoma, which is usually indolent.
Additional Information
Related Stat Facts by Subtype
- NHL - Chronic Lymphocytic Leukemia/Small Lymphocytic Lymphoma (CLL/SLL) Stat Facts
- NHL - Diffuse Large B-Cell Lymphoma (DLBCL) Stat Facts
- NHL - Follicular Lymphoma Stat Facts
More Information
Here are some resources for learning more about non-Hodgkin lymphoma.
- More about risk factors, symptoms, diagnosis, and treatment options for non-Hodgkin lymphoma
- More about clinical trials
- More about cancer prevention
References
All statistics in this report are based on statistics from SEER and the Centers for Disease Control and Prevention's National Center for Health Statistics. Most can be found within SEER*Explorer.
Suggested Citation
All material in this report is in the public domain and may be reproduced or copied without permission; citation as to source, however, is appreciated.
SEER Cancer Stat Facts: Non-Hodgkin Lymphoma. National Cancer Institute. Bethesda, MD, https://seer.cancer.gov/statfacts/html/nhl.html
These stat facts focus on population statistics that are based on the U.S. population. Because these statistics are based on large groups of people, they cannot be used to predict exactly what will happen to an individual patient. To see tailored statistics, browse SEER*Explorer. To see statistics for a specific state, go to the State Cancer Profiles.
The statistics presented in these stat facts are based on the most recent data available, most of which can be found in SEER*Explorer. In some cases, different year spans may be used.
Estimates of new cases and deaths for 2026 are projections made by the American Cancer Society (ACS), based on earlier reported data.
Cancer is a complex topic. There is a wide range of information available. These stat facts do not address causes, symptoms, diagnosis, treatment, follow-up care, or decision making, although links are provided to information in many of these areas.
