
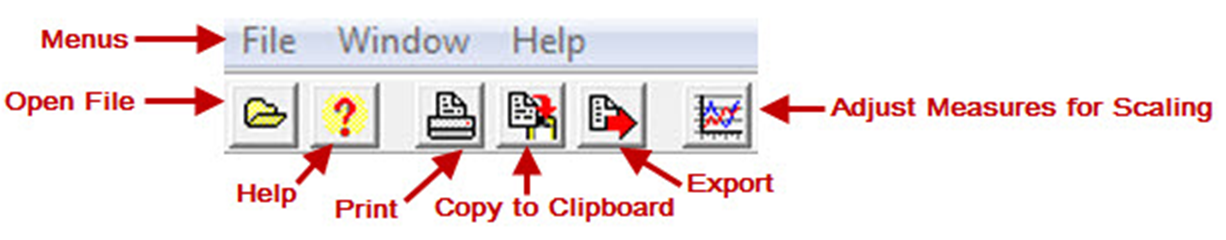
The Change Scaling Adjustment allows you to adjust the minimum, maximum, and interval size of the left and right axes of charts and to adjust the data displayed in tables. To open the Change Scaling Adjustment dialog, either go to File > Adjust Scaling or click on the Adjust Measures for Scaling (png, 187.1 KB) button ![]() .
.

Clear all the adjustments by clicking the Clear All button.

Change an adjustment by selecting the Disparity Measure you want to change. The Adjustment for that measure will appear in the Modify Adjustment dropdown.

Select the desired adjustment by clicking on the Modify Adjustment dropdown menu. Once selected, the adjustment value will appear next to the Disparity Measure.

Once you have made all the adjustments you want, click the OK button to save the adjustments or the Cancel button to close the dialog without saving them.