

Geographic areas were selected for inclusion in the SEER Program based on their ability to operate and maintain a high quality population-based cancer reporting system and for their epidemiologically significant population subgroups.
Table: Number of Persons by Race and Hispanic Ethnicity for SEER Participants (2020 Census Data)
Characteristics of the SEER Population Compared with the Total United States Population
The population covered by SEER is comparable to the general U.S. population with regard to measures of poverty and education. The SEER population tends to have a higher proportion of foreign-born persons than the general U.S. population.
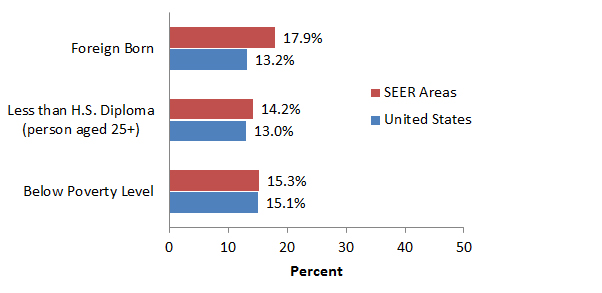
A bar chart showing percentages of the SEER population and the U.S. population for three characteristics:
- Below Poverty Level: 15.3% of the SEER population, 15.1% of the U.S. population;
- Less than a High School Diploma (persons aged 25 years or more): 14.2% of the SEER population, 13.0% of the U.S. population;
- Foreign Born: 17.9% of the SEER population, 13.2% of the U.S. population.
* The data source for these is the 2012-2016 American Community Survey. SEER areas included in this figure are the States of Connecticut, Hawaii, Idaho, Iowa, Kentucky, Louisiana, Massachusetts, New Mexico, New York, Utah, Wisconsin; multi-county areas of Atlanta, rural Georgia, remaining counties of Georgia, San Francisco-Oakland, Seattle-Puget Sound, San Jose-Monterey, Los Angeles county, remaining counties of California; and American Indians/Alaska Natives in Arizona, Alaska and Cherokee Nation.
