

Delay Adjustment
Every April, the NCI releases cancer statistics based on data submitted to the NCI in November of the previous year. For example, in April 2026, cancer statistics will be based on data available as of November 2025. It can be several months between the diagnosis of a case and when the cancer registry receives complete information on that case. In November 2025, information for cases diagnosed through 2023 are considered sufficiently complete to calculate official statistics, whereas data from diagnosis year 2024 still have a substantial undercount. Even with a lag time of nearly two years to increase data completeness, new cases and additional information will become available to the cancer registries in future submissions. A model is used to account for this delay, called the November submission delay model.
To obtain more up-to-date information on cancer trends and rates, the model was extended to model the undercount of cases based on an earlier look at the data. Data from nine months earlier (February 2026, rather than November 2026) were used to determine preliminary estimates of rates and trends for cases diagnosed through 2024. The preliminary estimates presented on the Preliminary Estimates for 2024 page are based on data submitted to the NCI in February as well as the application of the February submission delay model to the data. For more information about the delay model, visit Cancer Incidence Rates Adjusted for Reporting Delay.
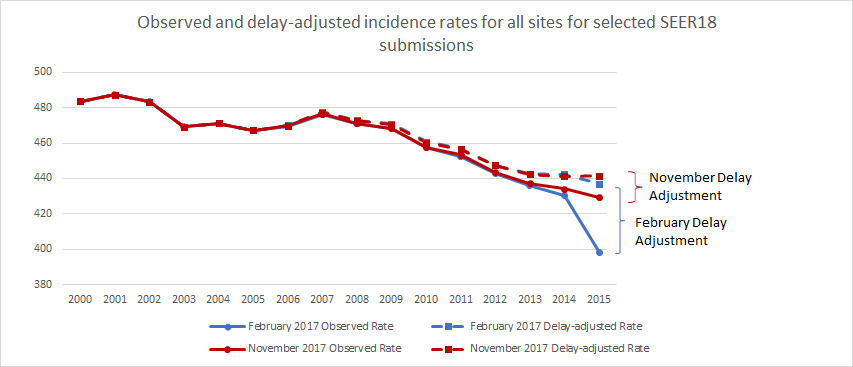
The graph below shows the effect of delay adjustment as compared with observed data for all cancer sites combined. The February 2017 delay-adjusted rate is greater than the February 2017 observed rate to make up for the undercount of cases in the February 2017 submission. The February and November delay-adjusted rates are fairly similar, even though the size of the adjustment is much larger for February. The fact that the February and November delay-adjusted rates are similar provides some validation of the February submission delay model. For more information, see Validation.
Selected Registries Based on Completeness and Consistency of Historical February to November Case Count Ratio
To further ensure that rates and trends derived from a February submission are as accurate as possible, a second step was conducted limiting the registries that meet a certain specified criteria, including (1) having sufficient historical February data; (2) meeting a completeness threshold; and (3) with consistent historical ratios of the initial February to subsequent November case counts for recent diagnosis years.
For the full set of SEER 21 registries, four of the newest registries (Illinois, New York, Idaho, and Texas) were evaluated to determine if they had a sufficient history of February submissions to conduct delay modeling. As of 2026 February, all four registries have sufficient history to estimate delay-adjusted rates.
Completeness is a data quality measure used within the SEER Data Quality Program (DQP). It is calculated by computing an expected count for each registry--estimated by projecting case counts from the series of initial November submissions (which occurs 22 months after the end of a calendar year) for an additional year-- and then comparing this expected count to the observed count. The observed-to-expected ratio is called the "completeness measure." The DQP standards are 95% for the subsequent February submission and 98% for the following November submission. The completeness ratio is computed for each of the SEER 21 registries with sufficient historical February submission data; registries that do not meet the 95% threshold are excluded from consideration. While 95% remains the DQP standard, the threshold for including registries in preliminary estimates may vary in future years based on further evaluation.
Statistical modeling to derive delay adjustment factors depends analyzing how quickly cases accumulate for prior diagnosis years. Therefore, to ensure delay factors for each registry do not exhibit too much year-to-year variation, the initial February and subsequent November submissions of case count for each diagnosis year for recent diagnosis years should not display too much discrepancy. For each diagnosis year we calculate the ratio of the case count from the first February submission (14 months after the diagnosis year has ended) to the case count from the first November submission (22 months after the end of the diagnosis year) for each registry. The average of these ratios calculated from the past six diagnosis years (2018-2023) needs to be greater than 90% and standard deviation less than .05. Registries that did not meet these thresholds were excluded from the analysis.
