

Preliminary Trends and Rates are also available in SEER*Explorer.
Caution is advised when interpreting these figures, as these are preliminary results and are subject to change with the addition of data from future case submissions.
Estimates are available for 24 cancer sites by sex and for both sexes combined. Due to less stability of the preliminary estimates by race and ethnicity, at this time, estimates are only available for all races and ethnicities combined.
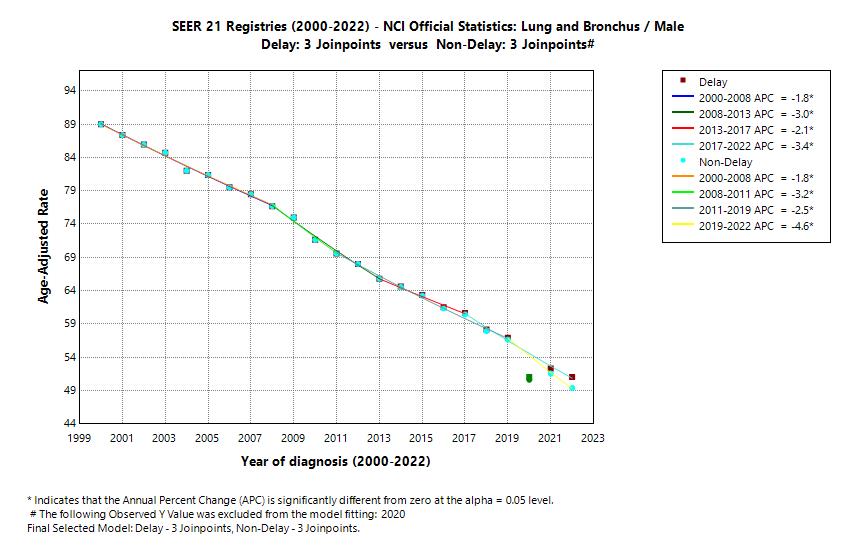
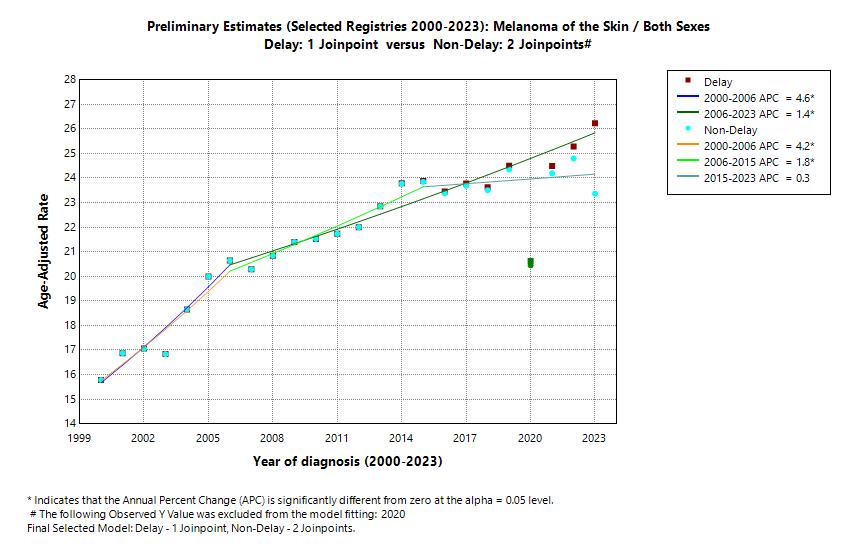
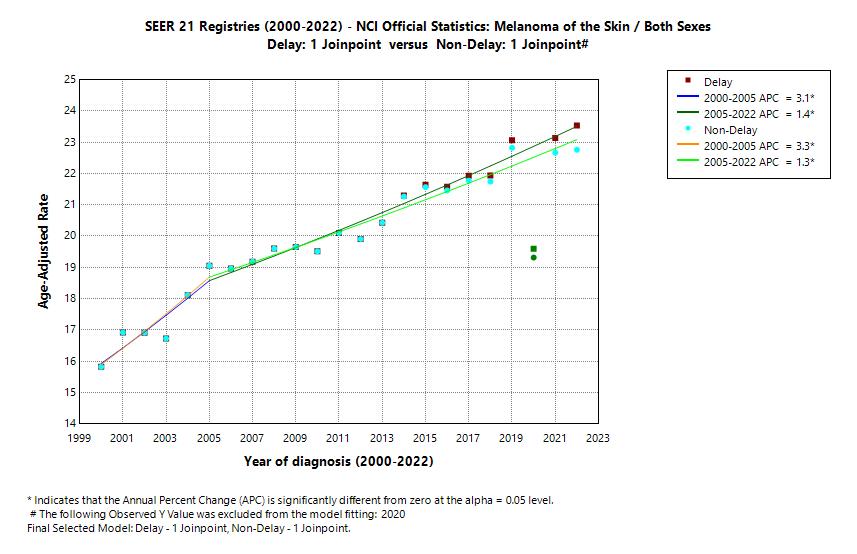
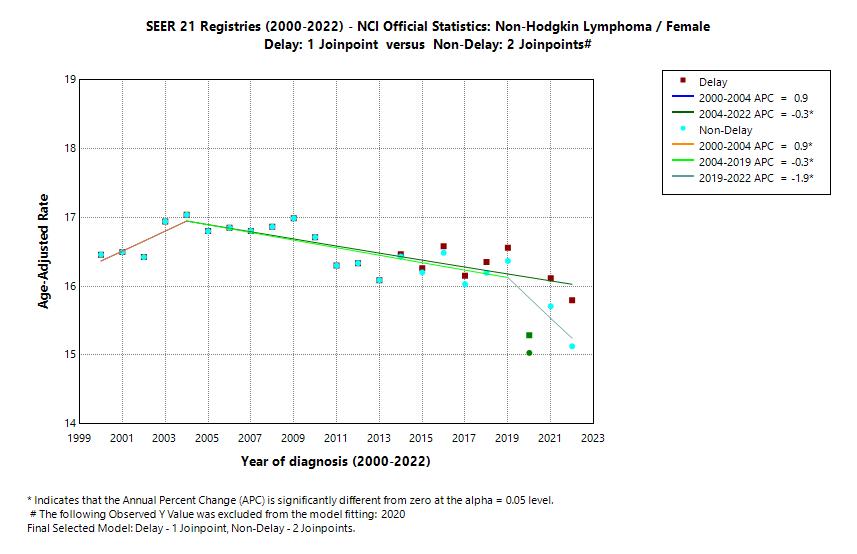
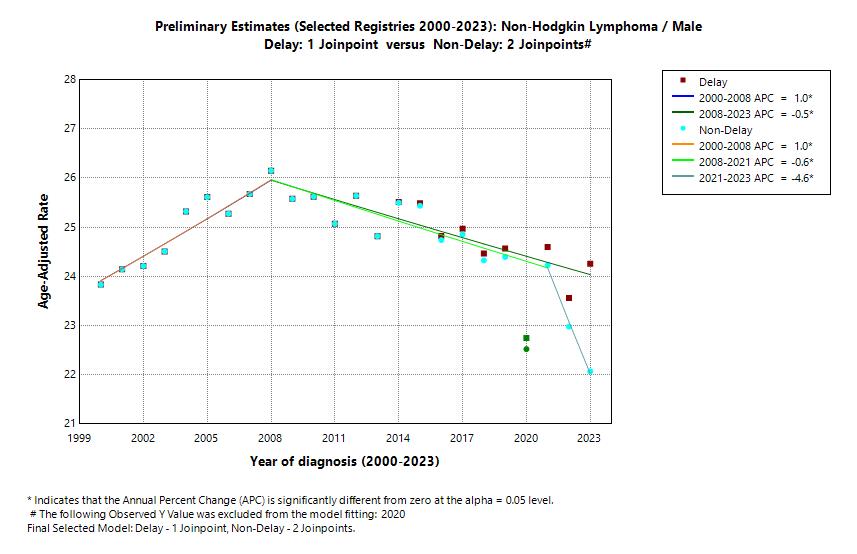
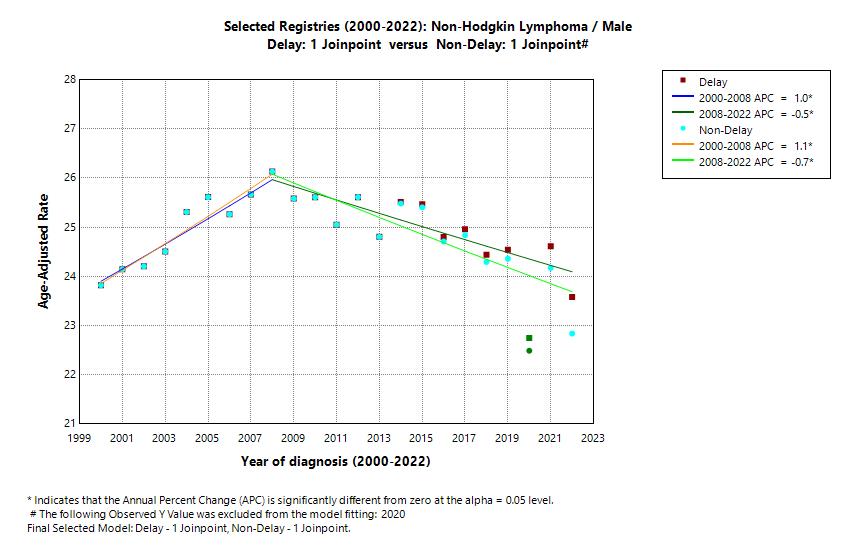
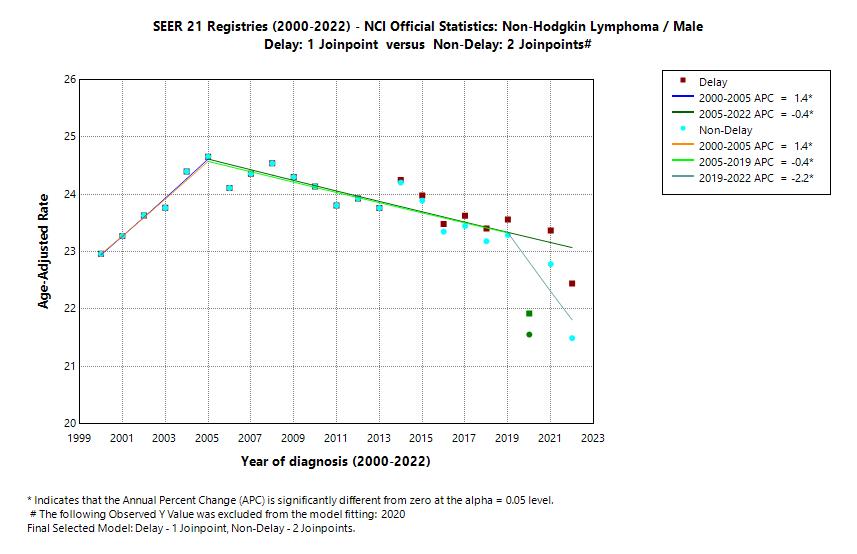
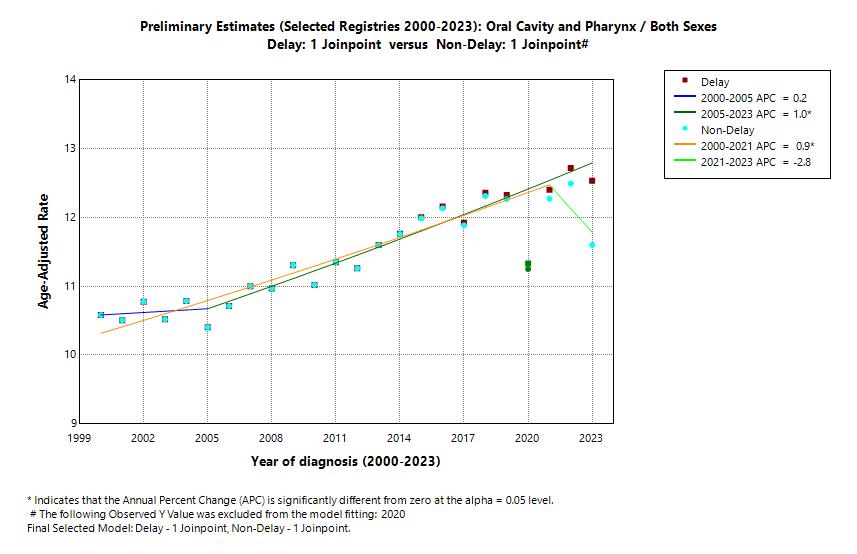
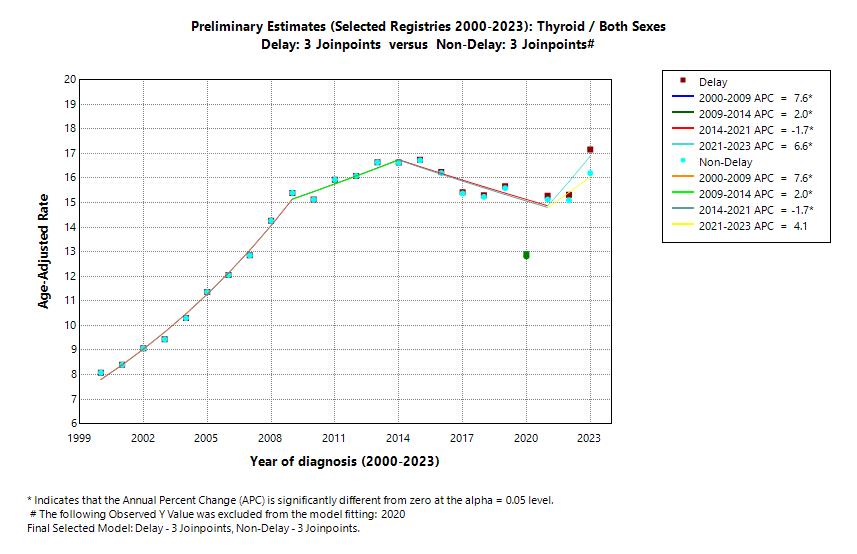
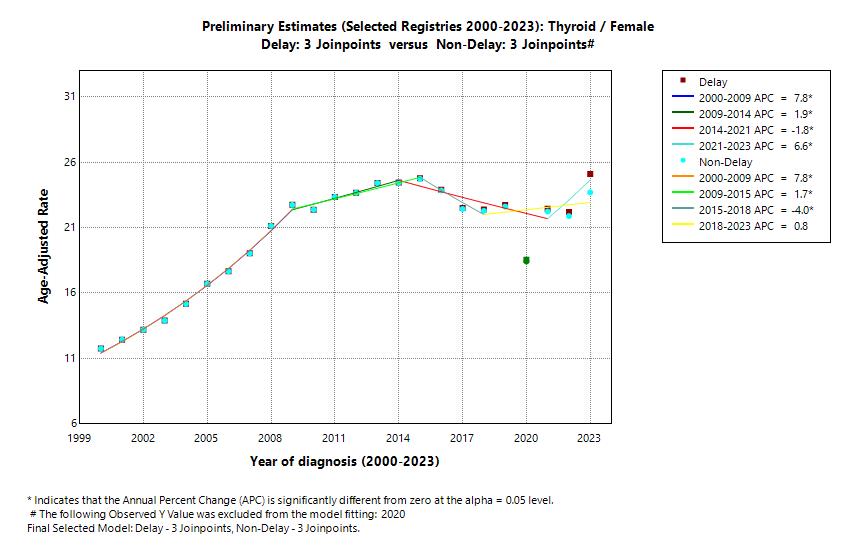
To assist users in understanding the preliminary estimates, three graphs are presented for each cancer site and sex combination (60 total data series adjusting for single sex cancer sites). For each graph, two series are presented: the observed rates (not adjusted for the undercount), and rates adjusted for the undercount of cases (called "delay-adjusted" rates). For each graph, by comparing the observed to delay-adjusted rates for the most recent years, users can see the magnitude of the undercount. While the delay-adjustment varies by cancer site, the adjustment for the most recent year of diagnosis averages around 3% for the official April release of the data, while the adjustment for the preliminary data based on the February submission averages around 9%.
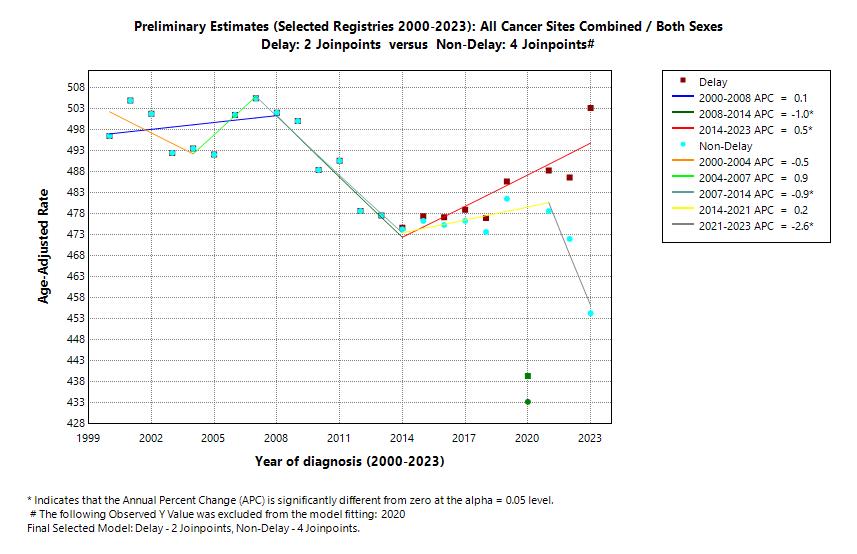
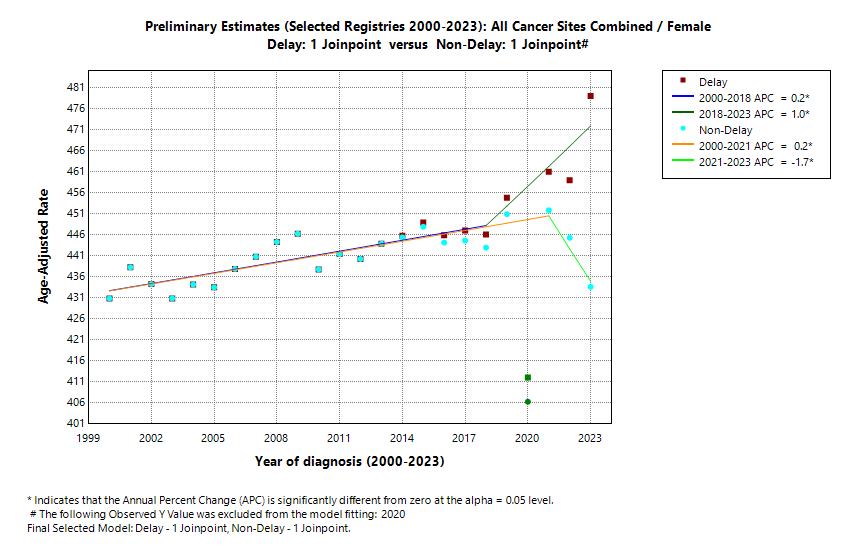
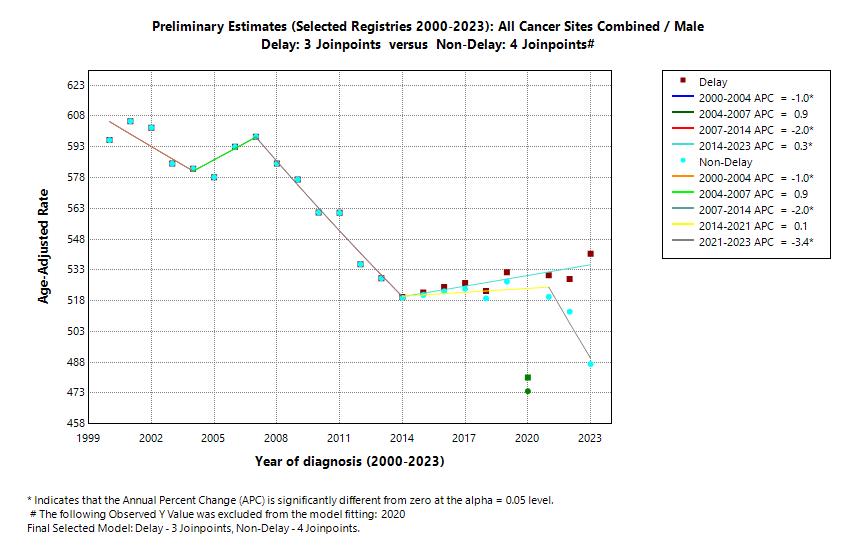
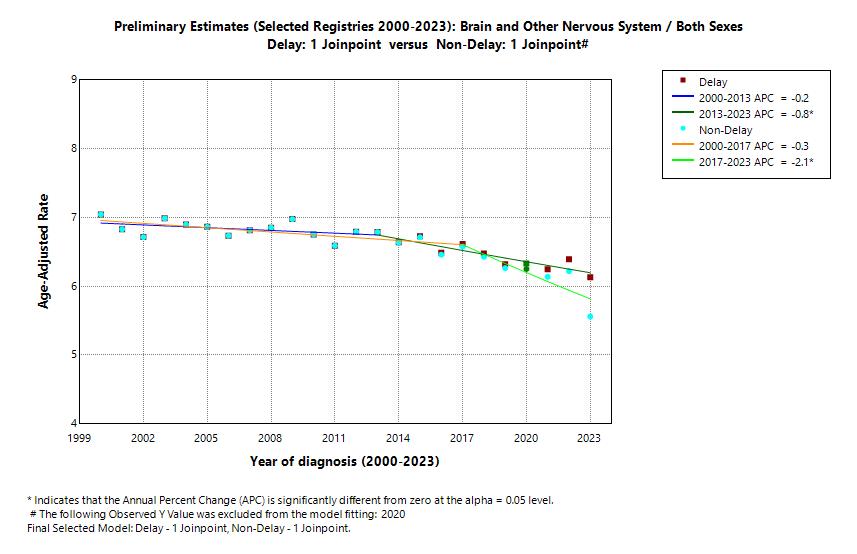
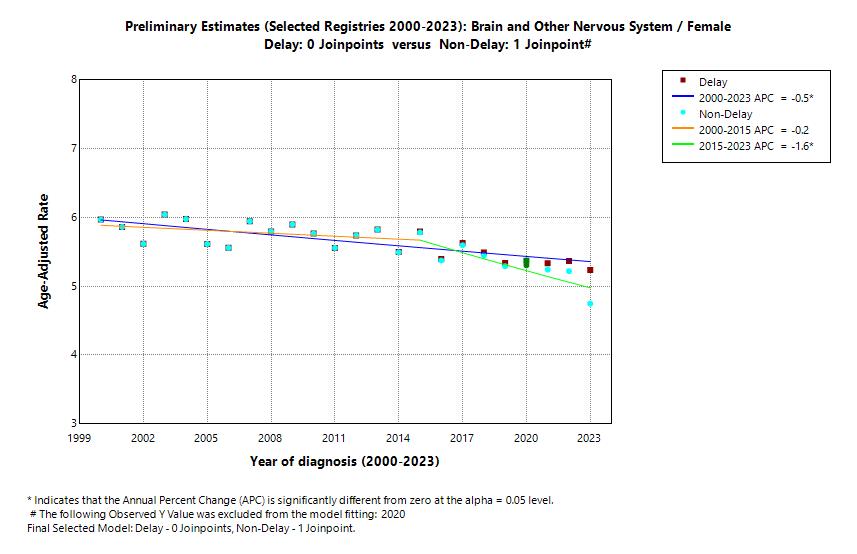
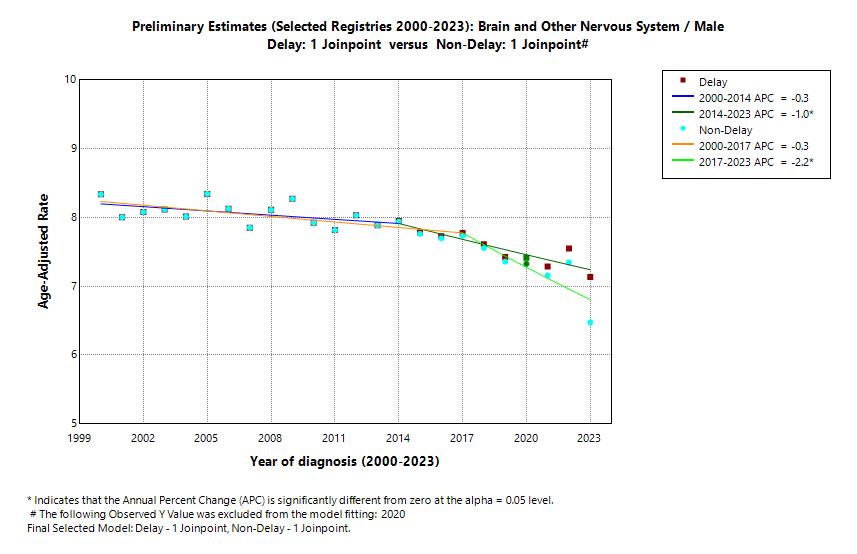
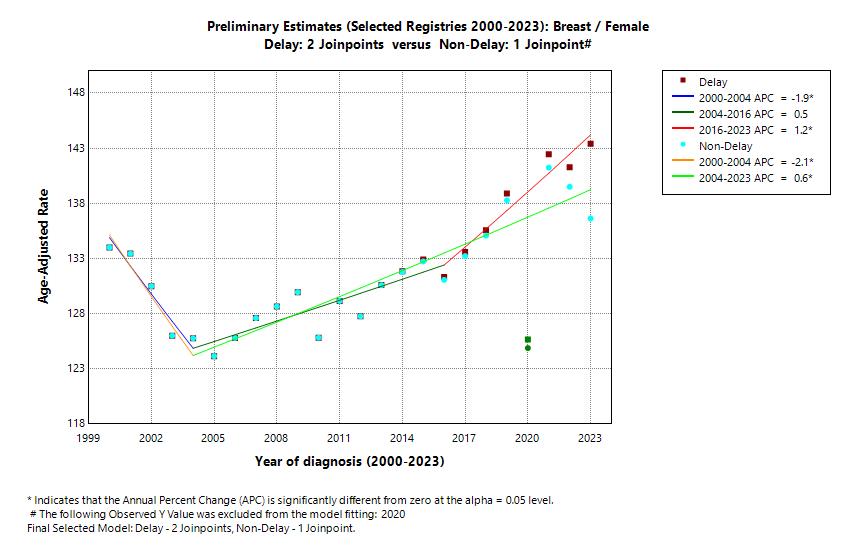
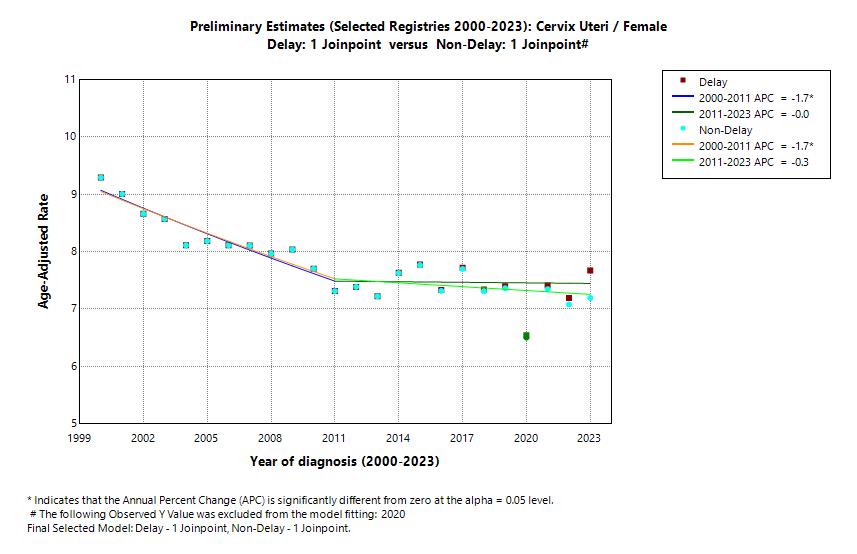
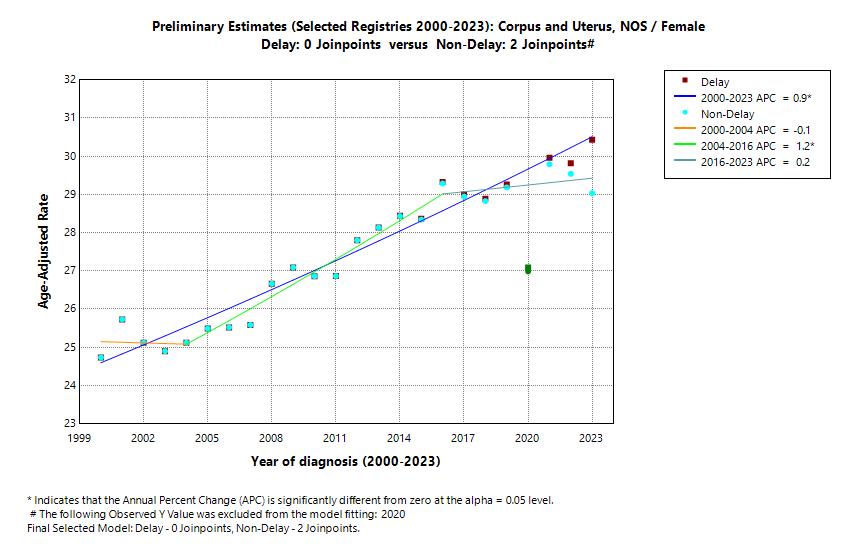
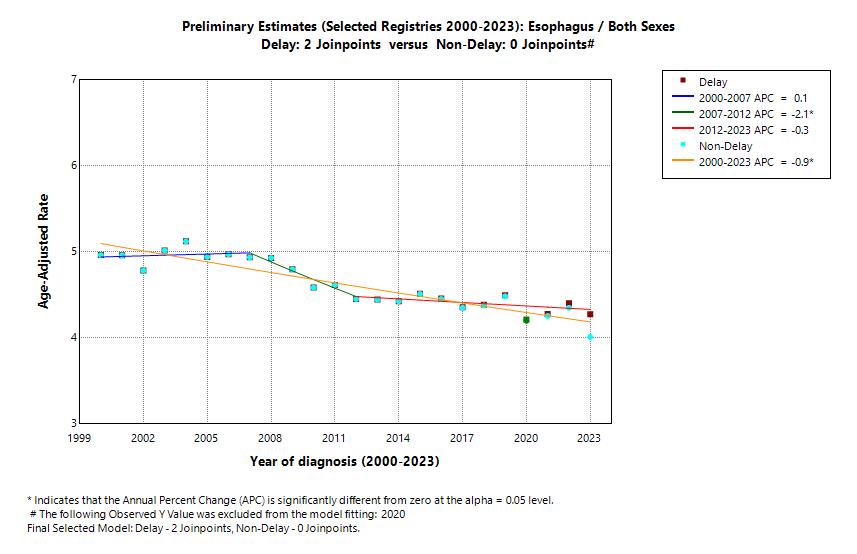
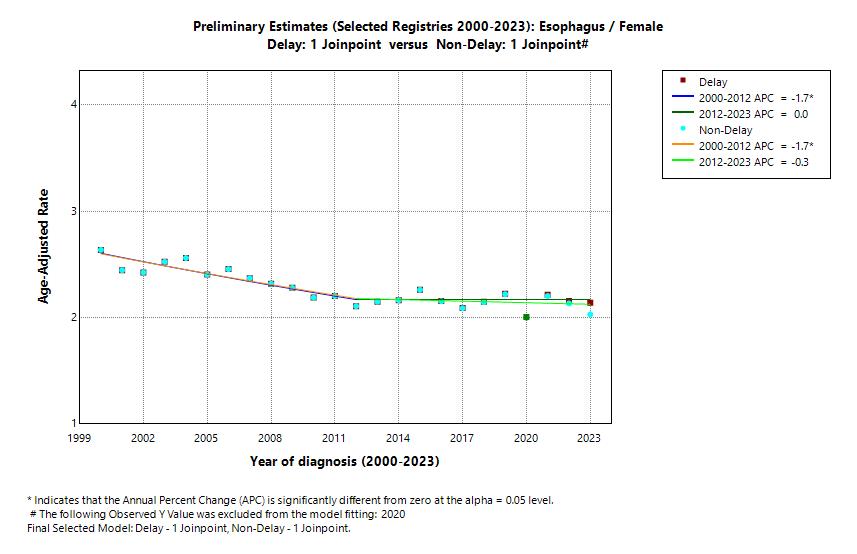
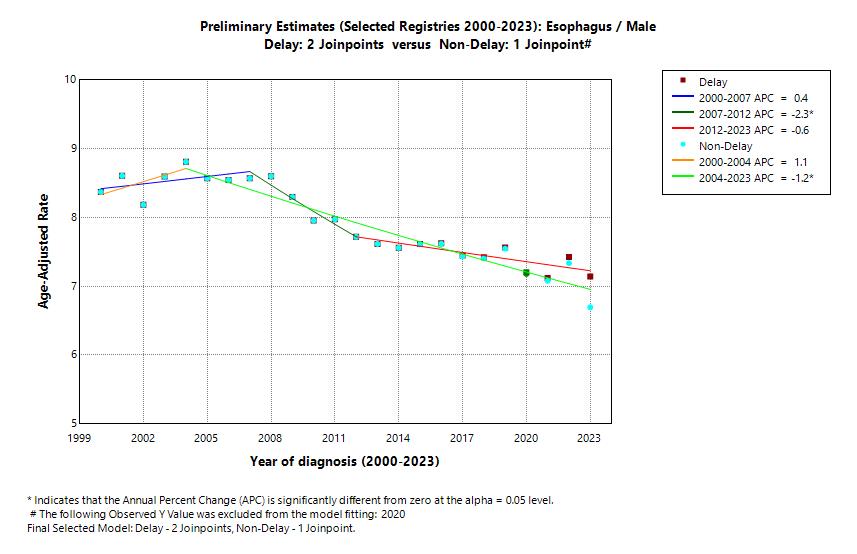
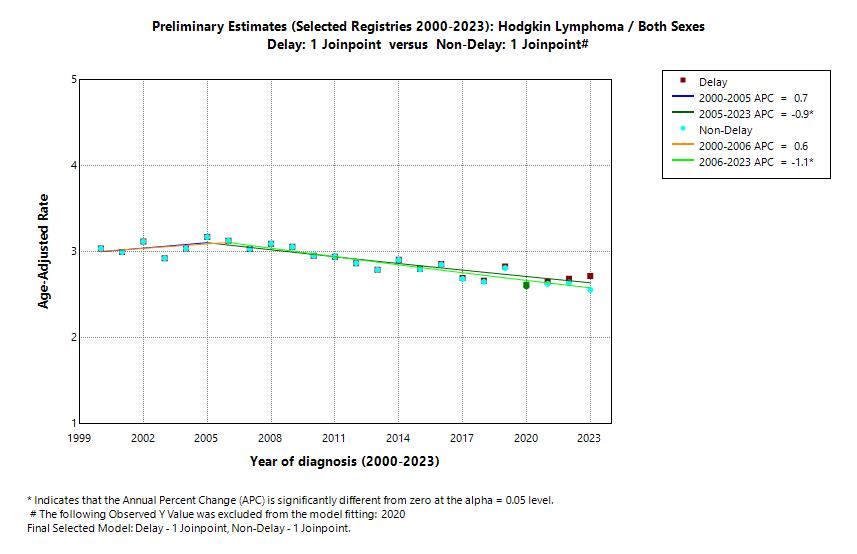
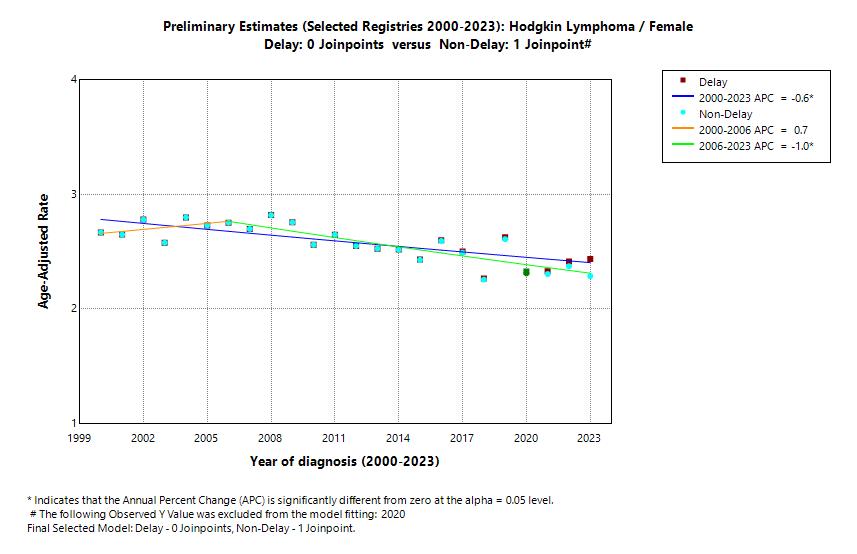
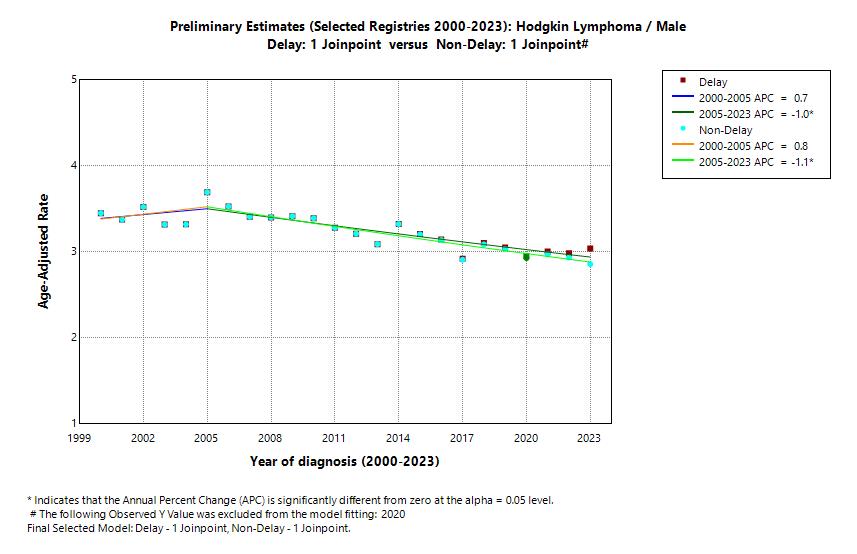
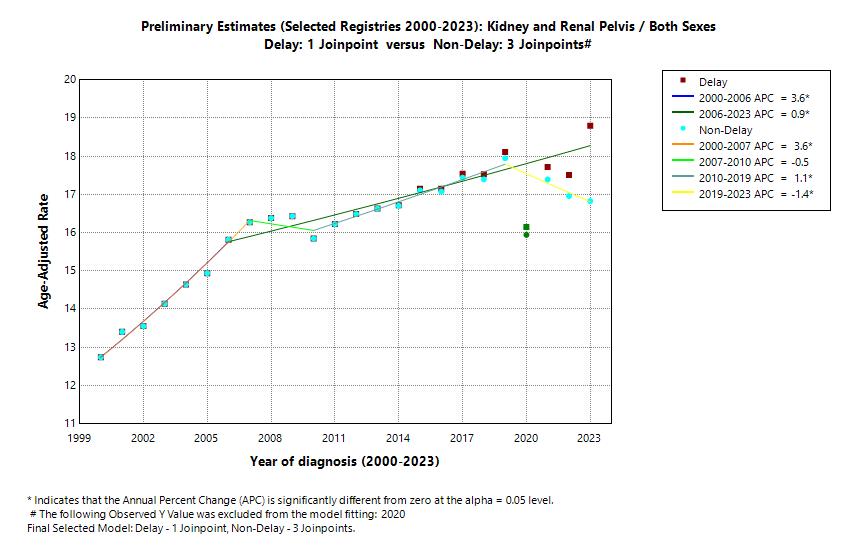
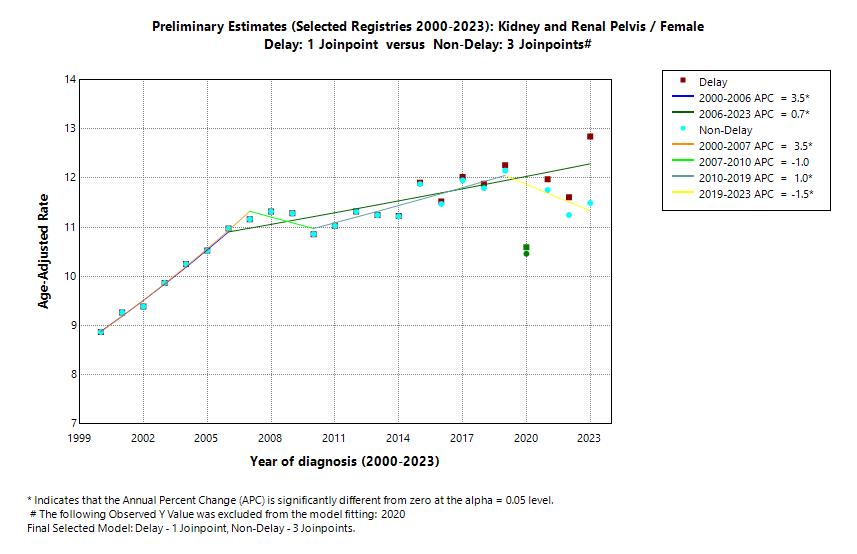
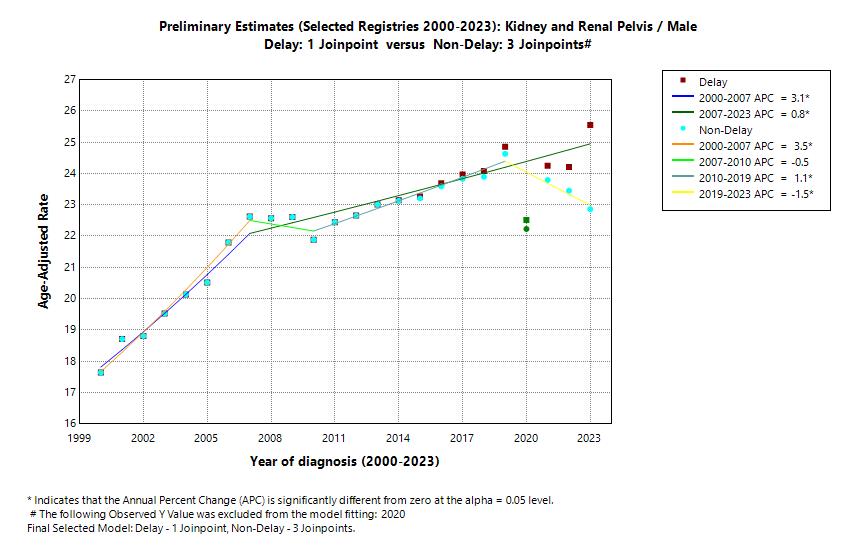
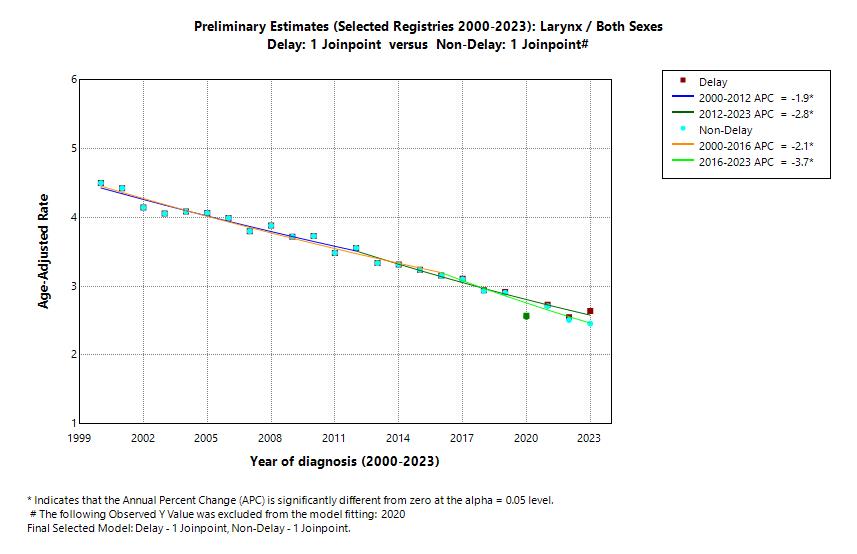
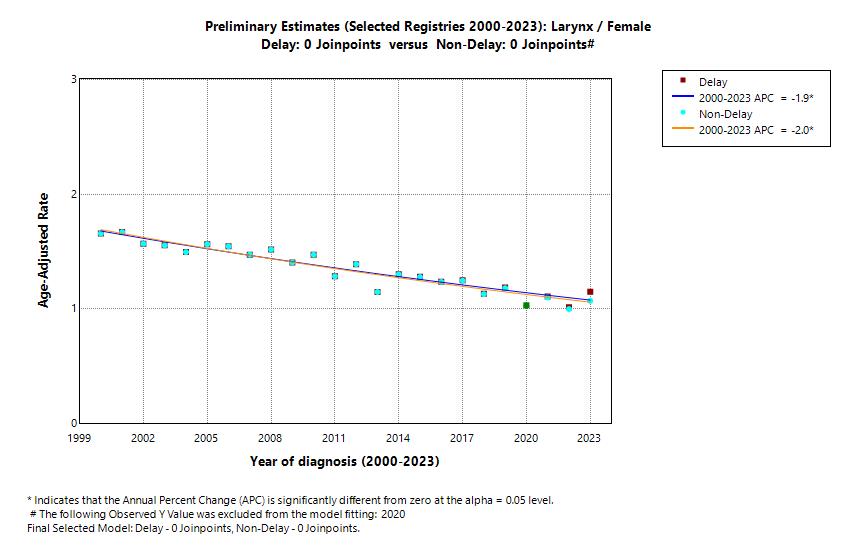
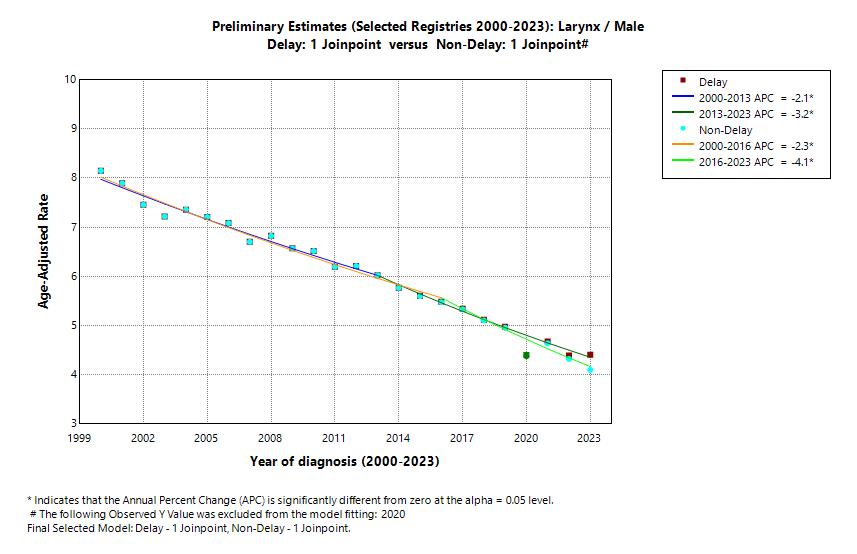
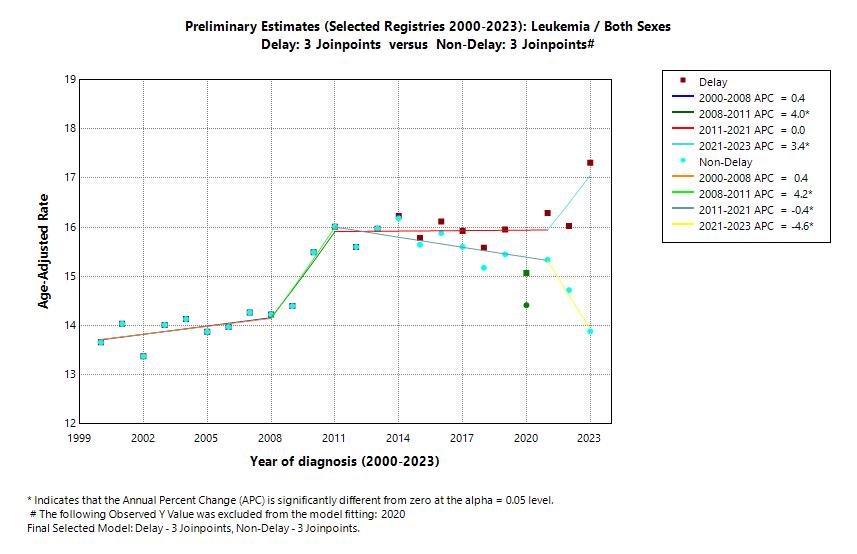
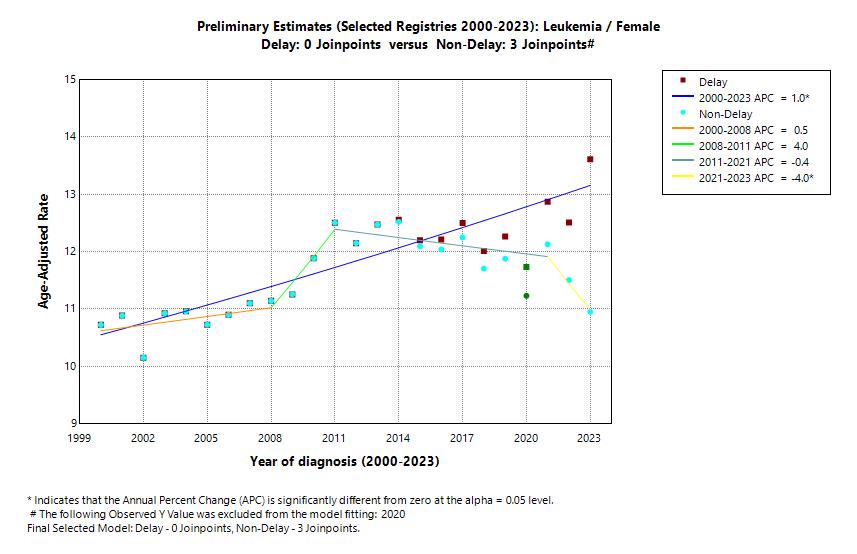
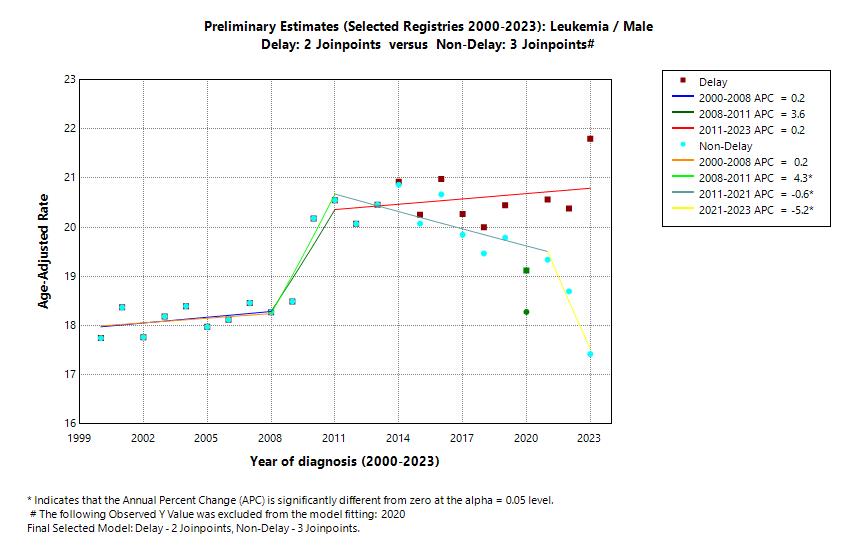
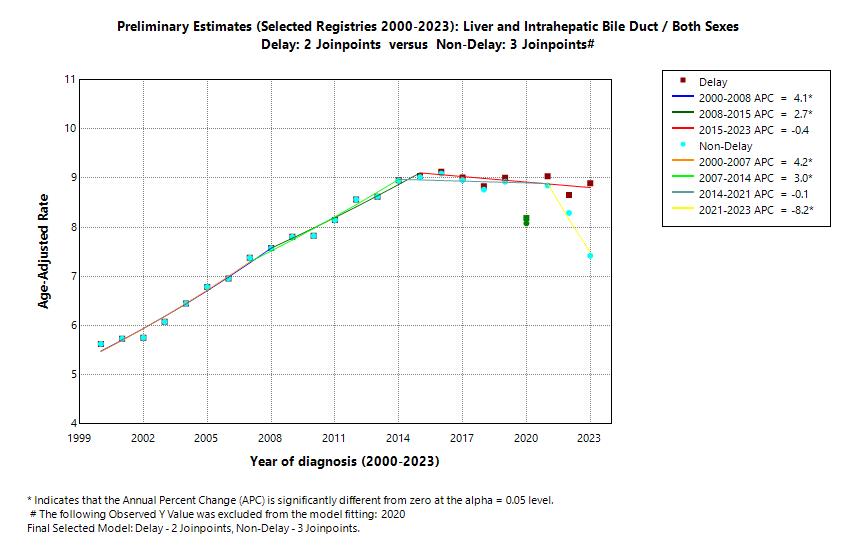
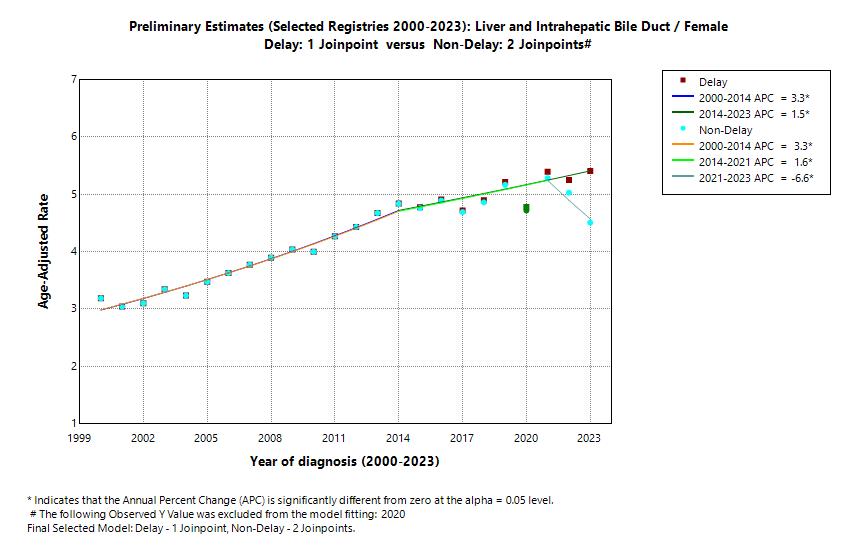
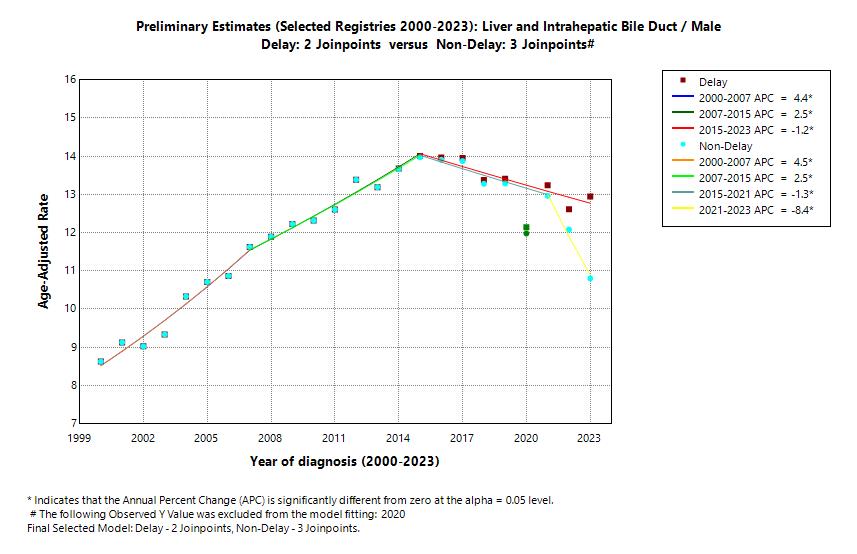
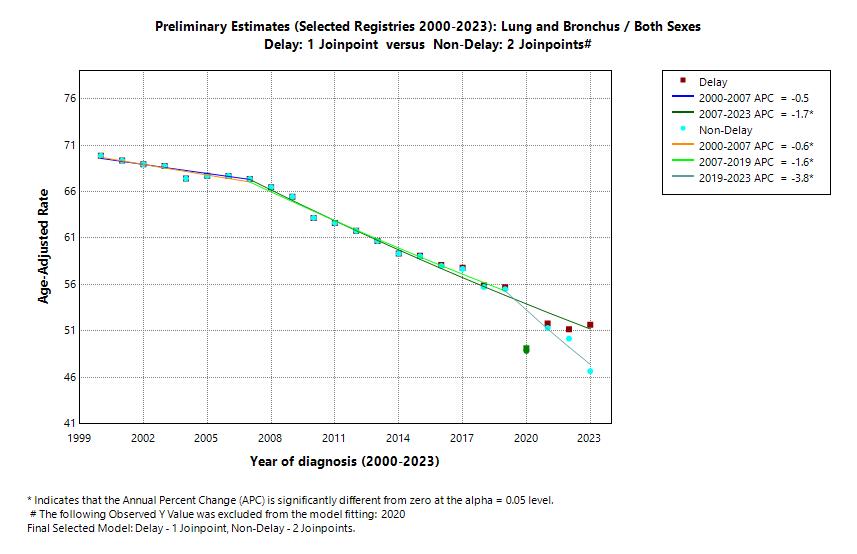
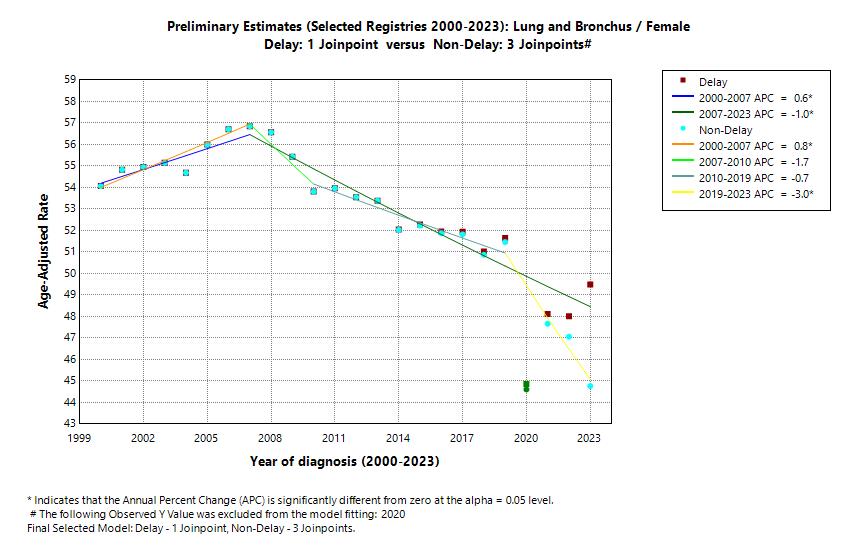
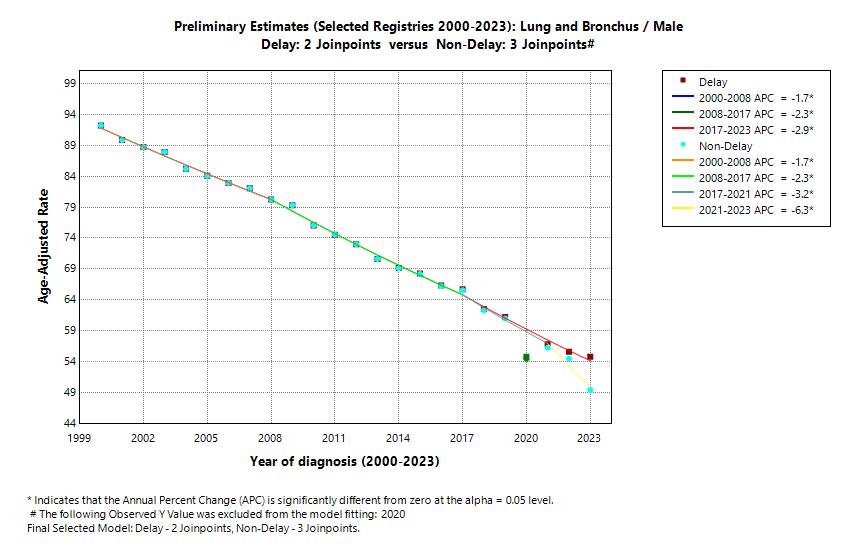
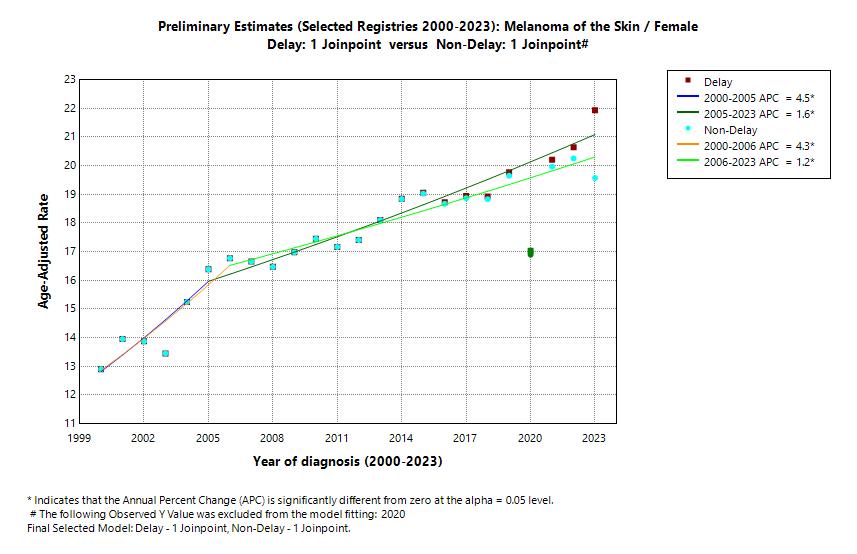
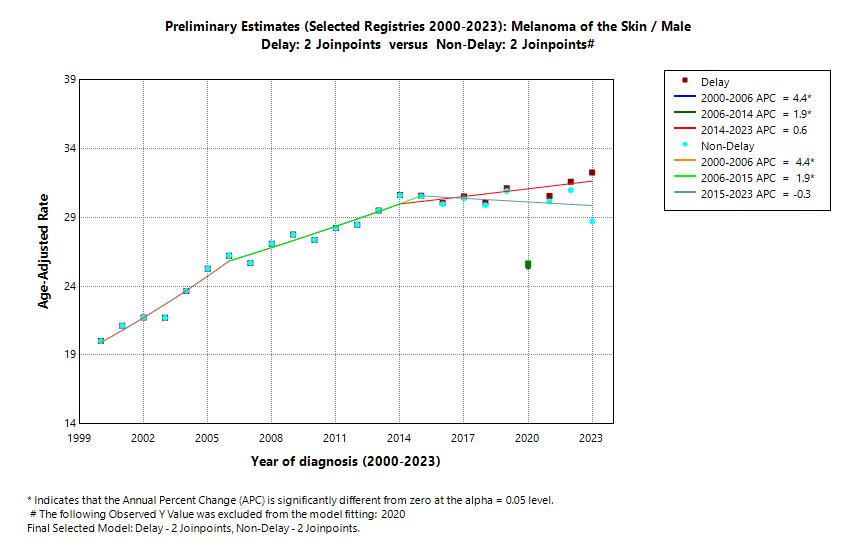
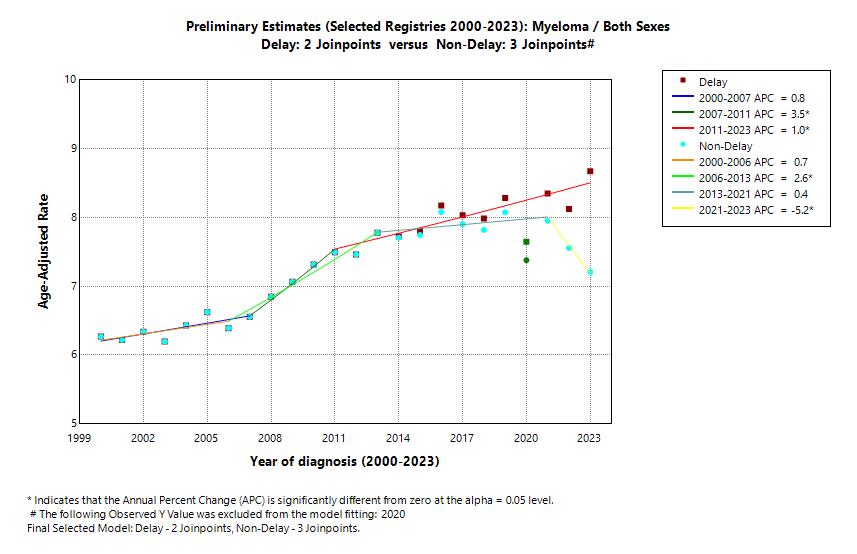
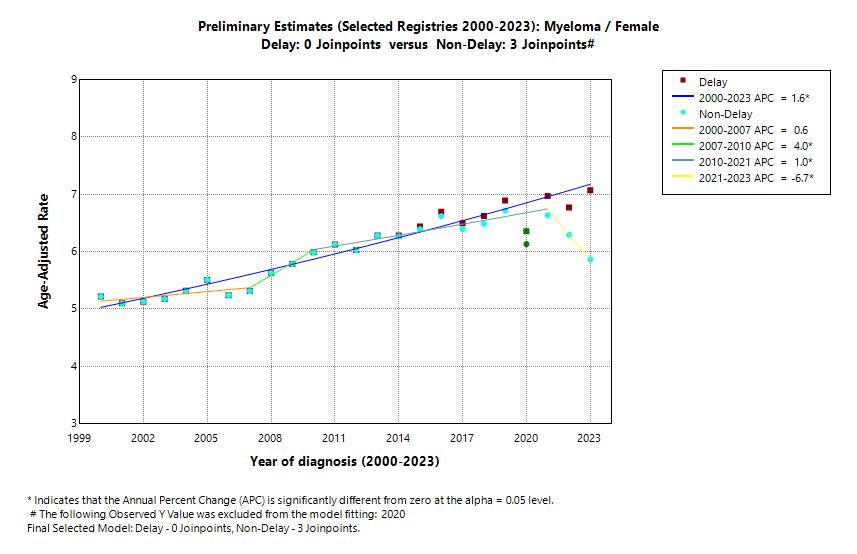
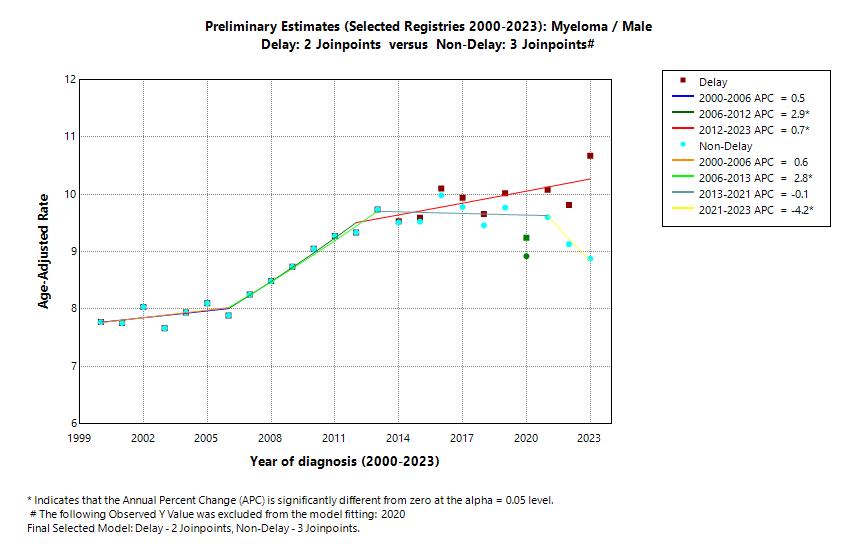
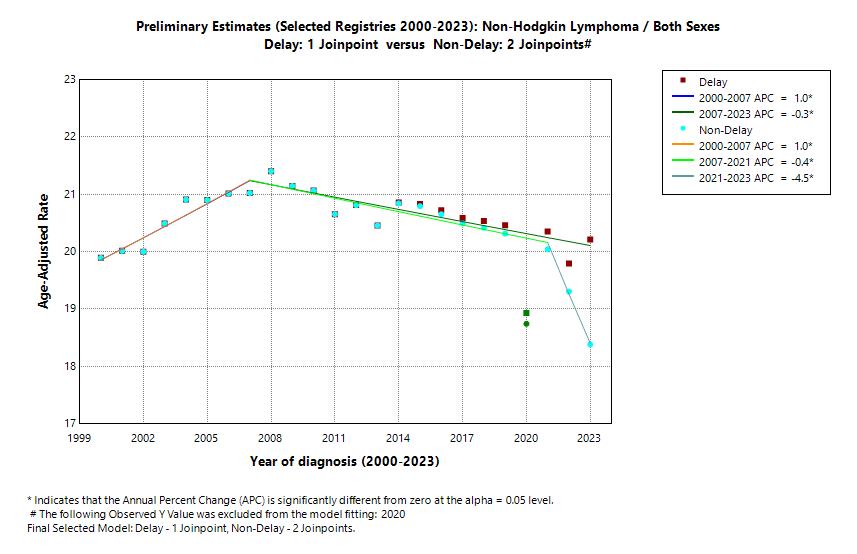
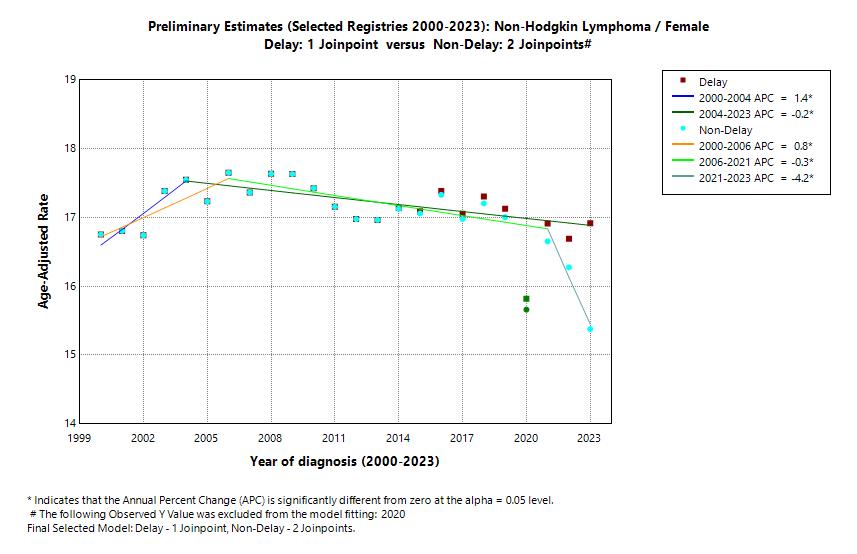
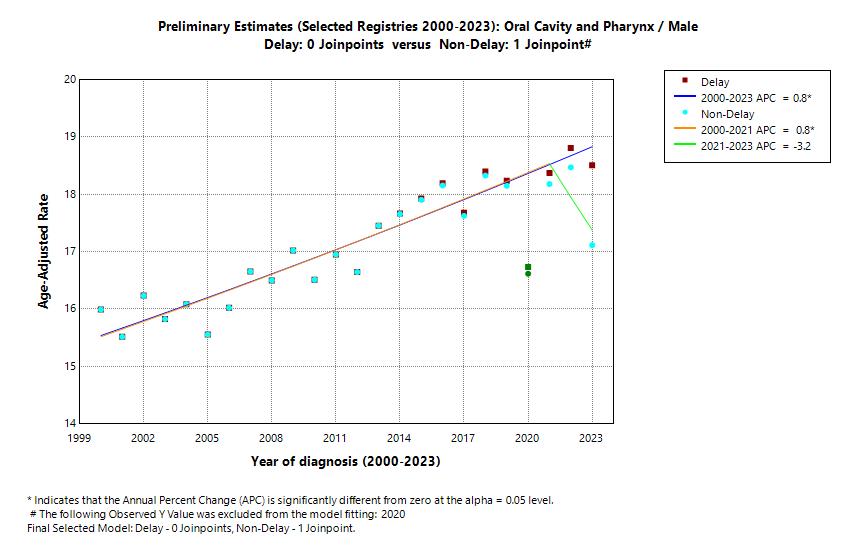
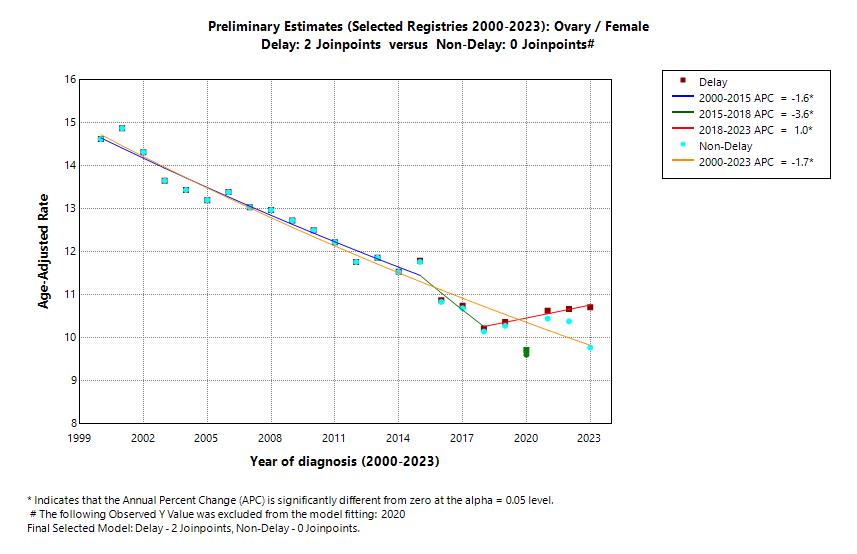
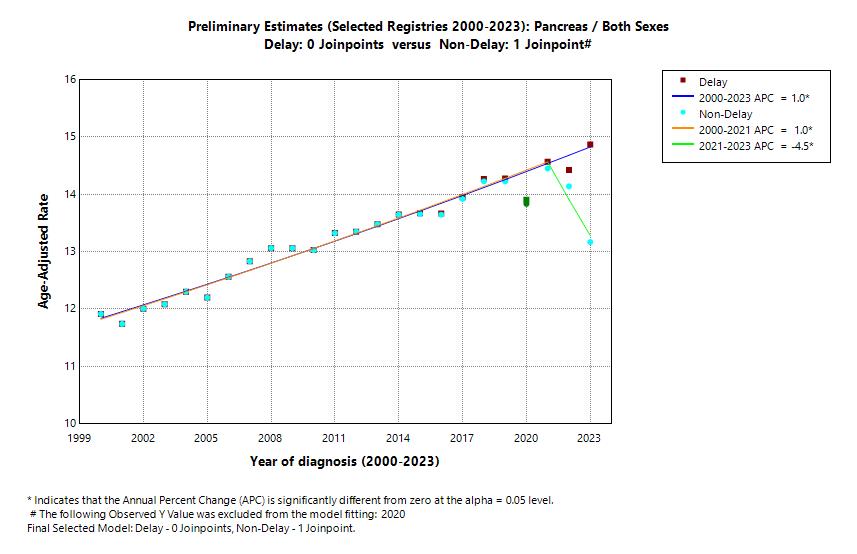
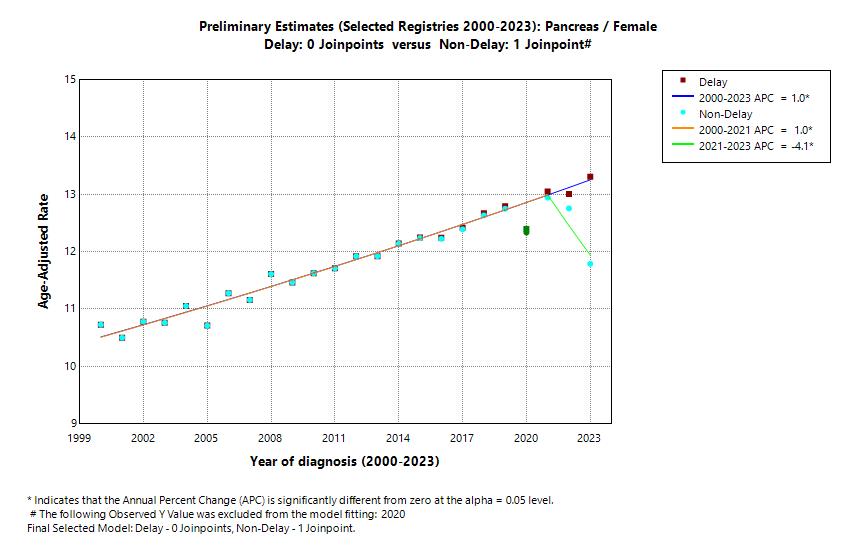
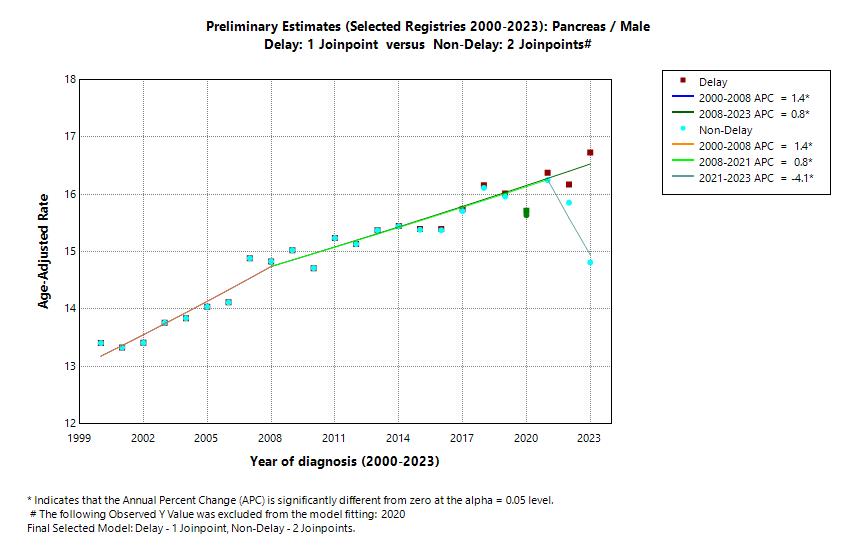
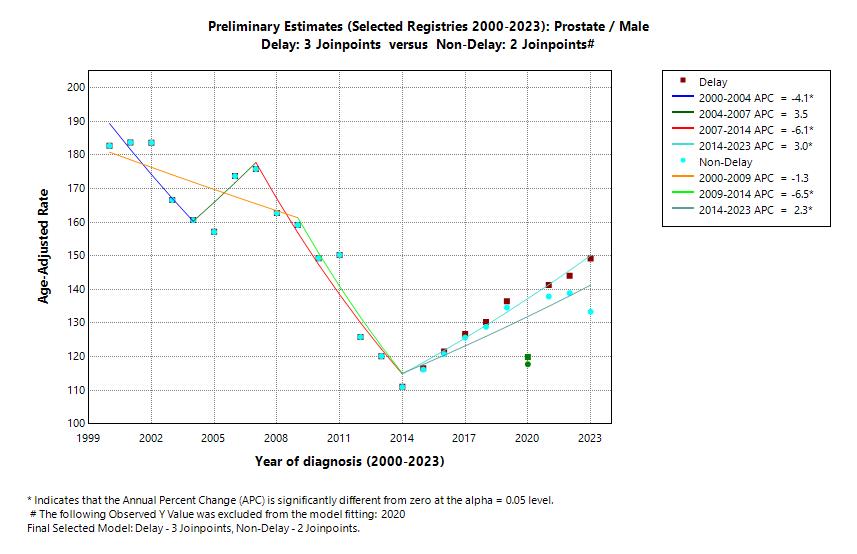
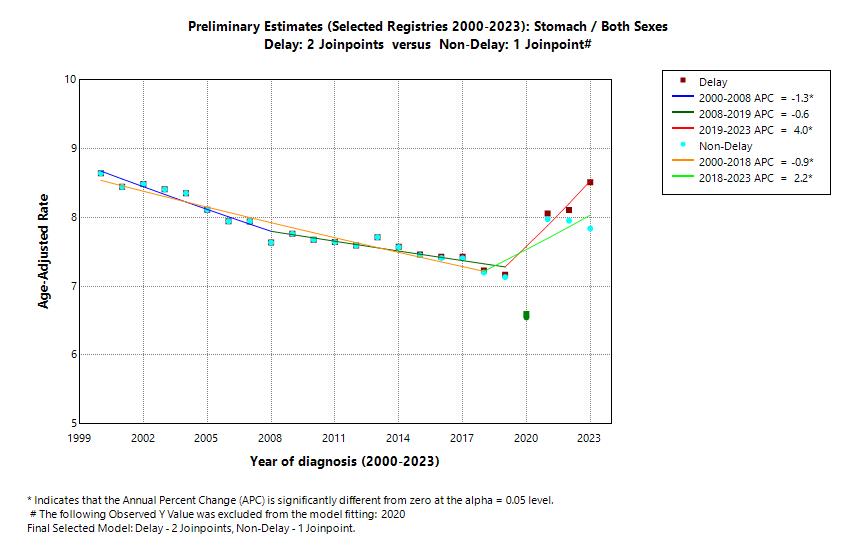
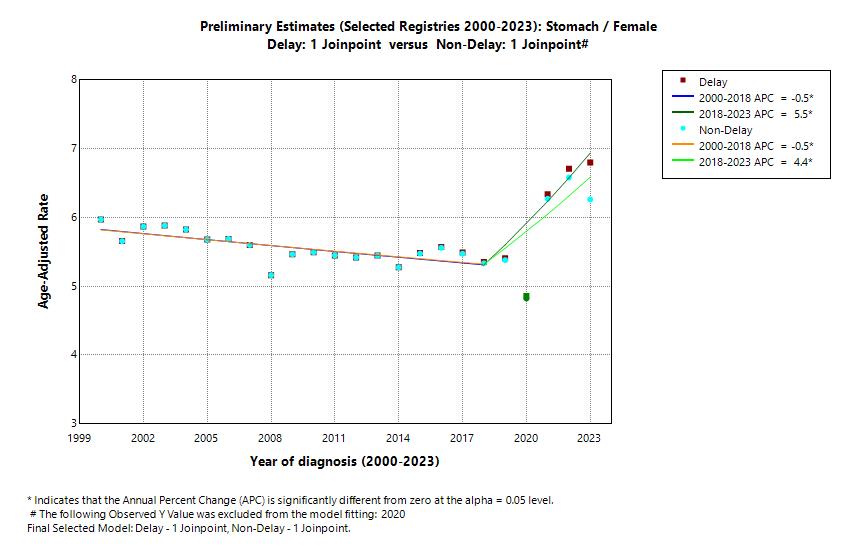
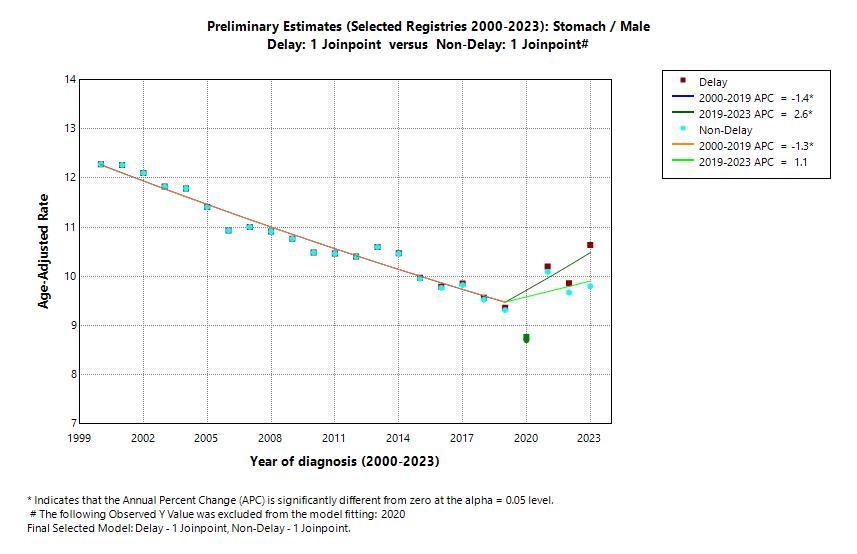
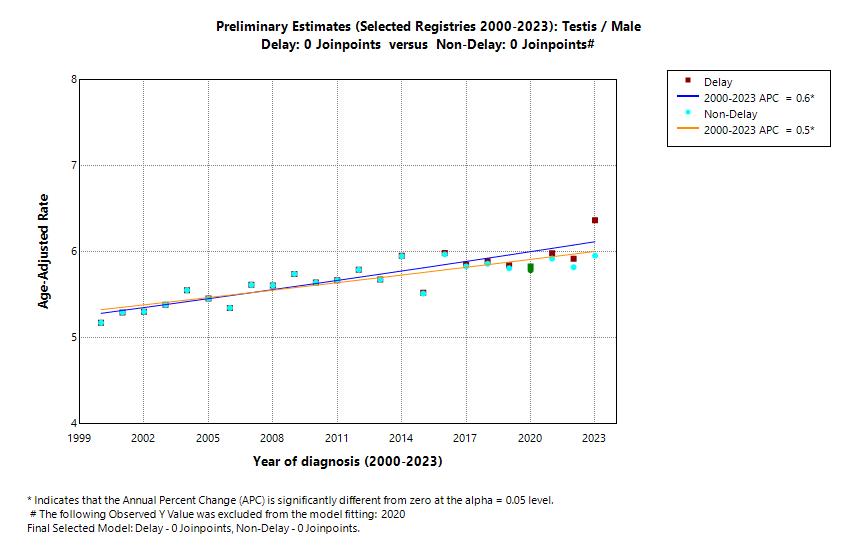
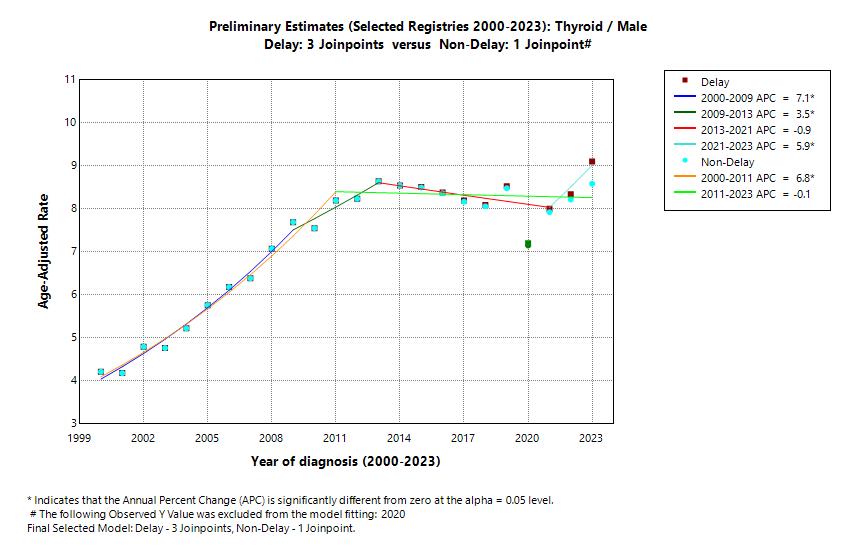
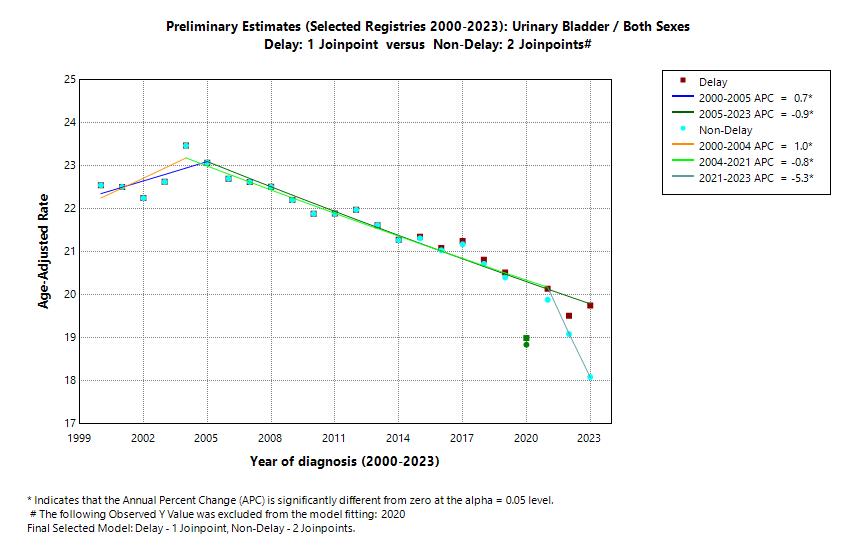
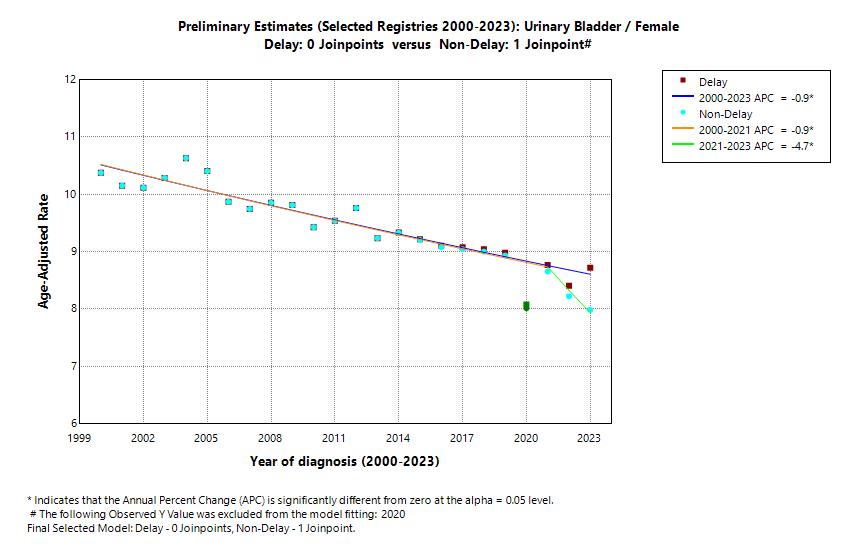
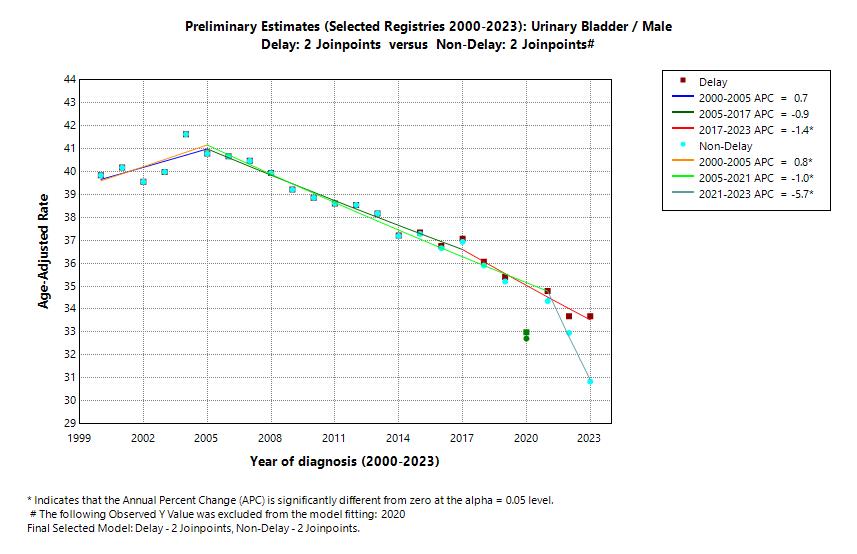
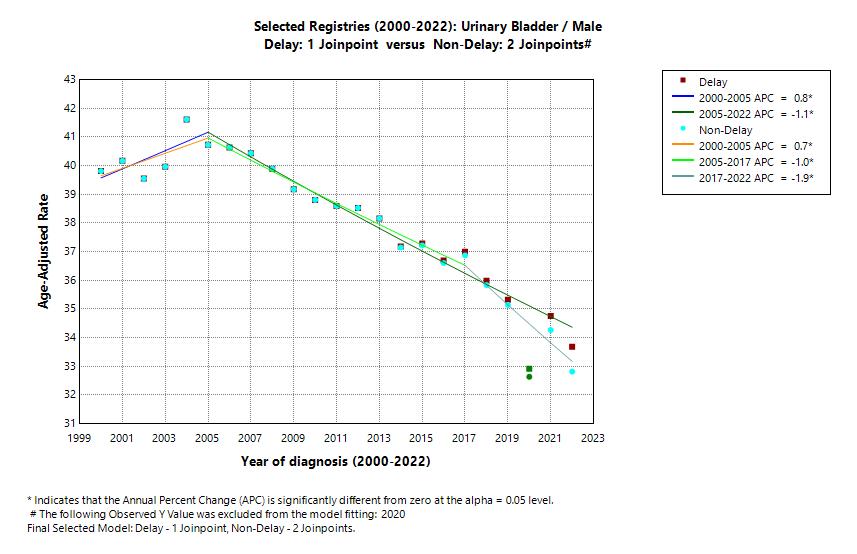
- Graph 1: Preliminary Estimates (Selected Registries 2000-2024)
Estimates are based on the February 2026 data submission and include only registries that met three criteria: (1) sufficient historical February submission data, (2) at least 95% case completeness for diagnoses in 2024, and (3) consistent historical ratios of the initial February to subsequent November case counts for recent diagnosis years. The registries meeting these three criteria are: Alaska Native Tumor Registry, Connecticut, Greater Bay (San Francisco and San Jose), Hawaii, Illinois, Iowa, Louisiana, New Jersey, New York, Seattle and Utah. These registries represent approximately 22% of the U.S. population and about 47% of the population covered by the SEER 21 registries in the Official Release.
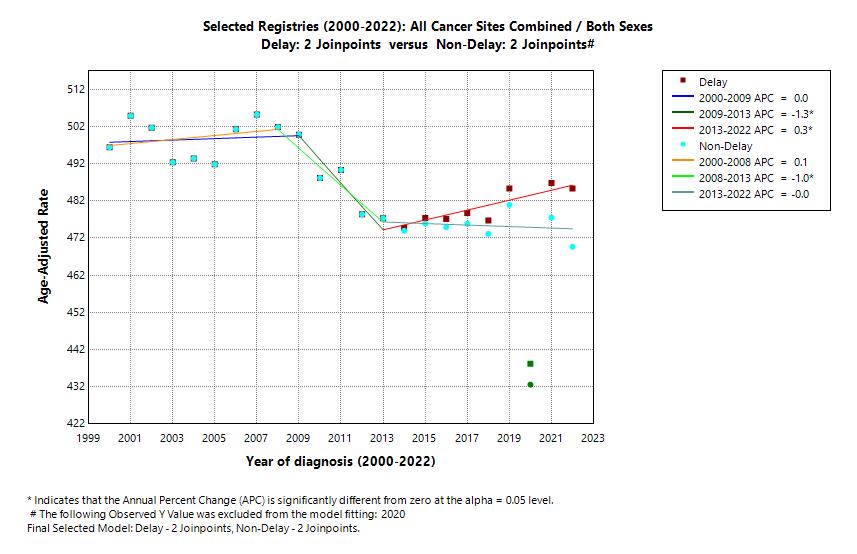
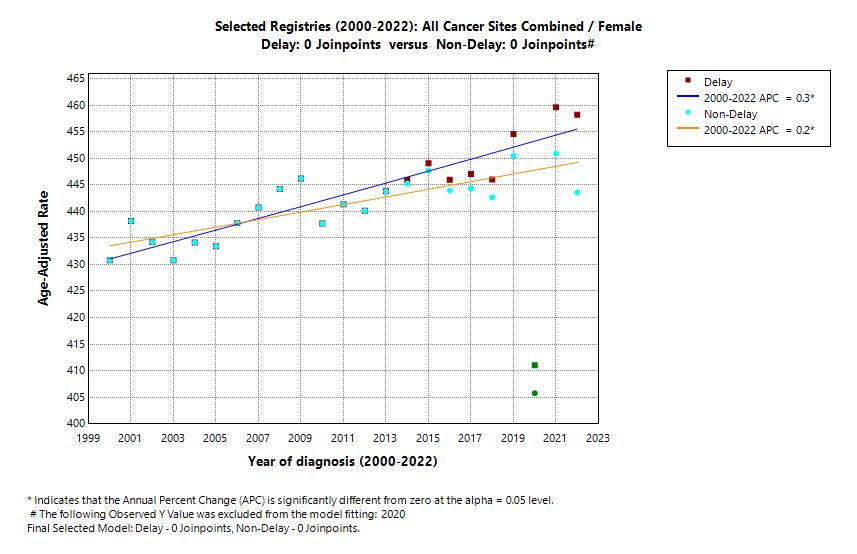
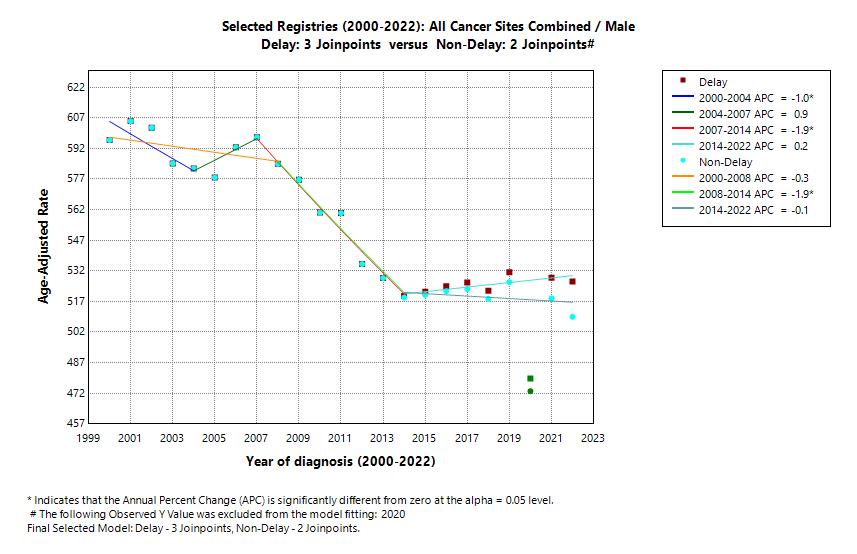
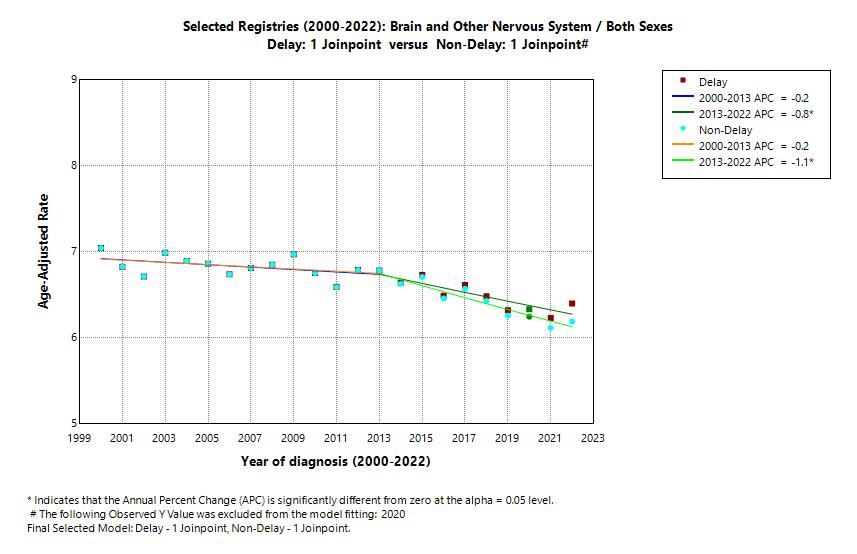
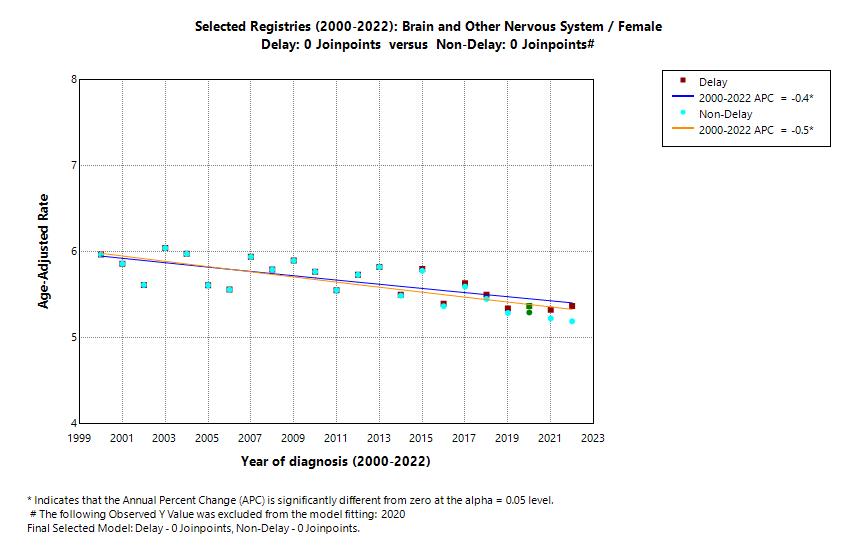
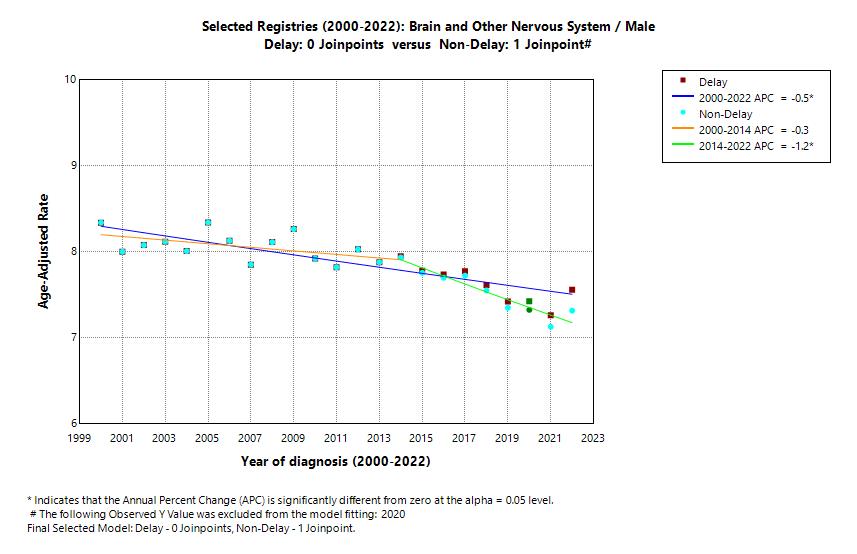
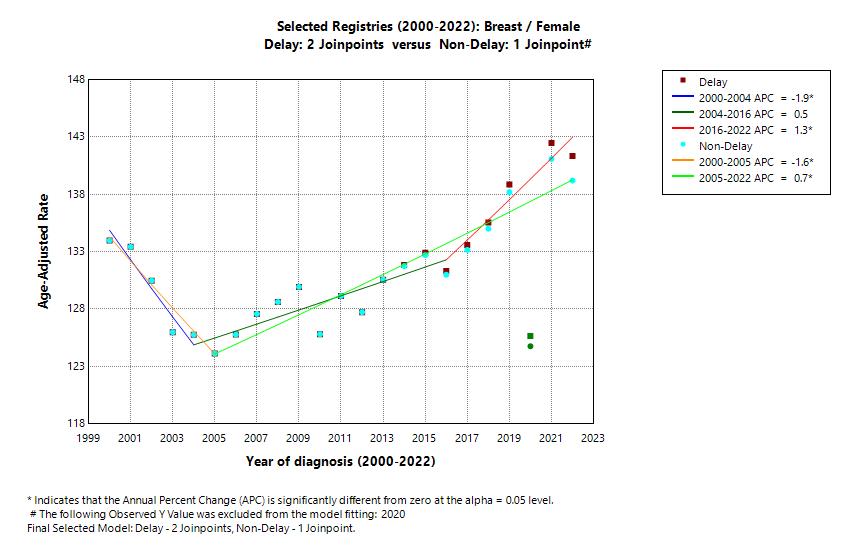
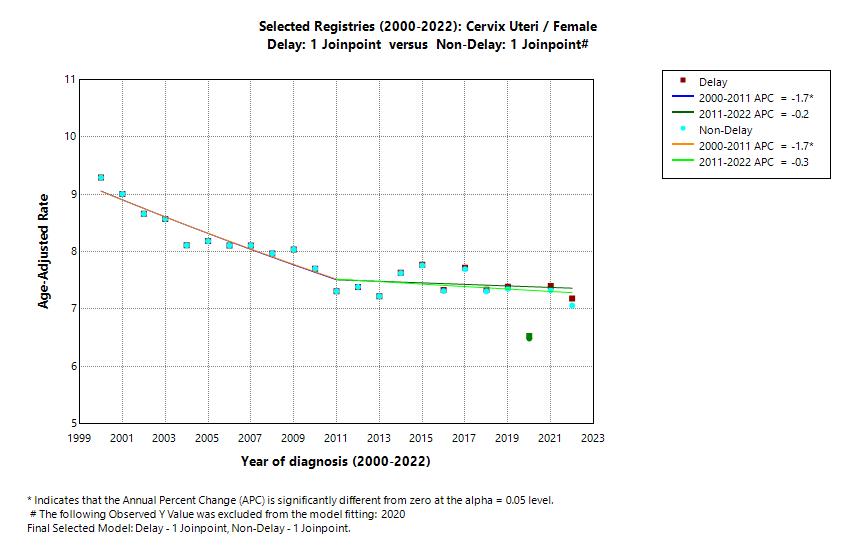
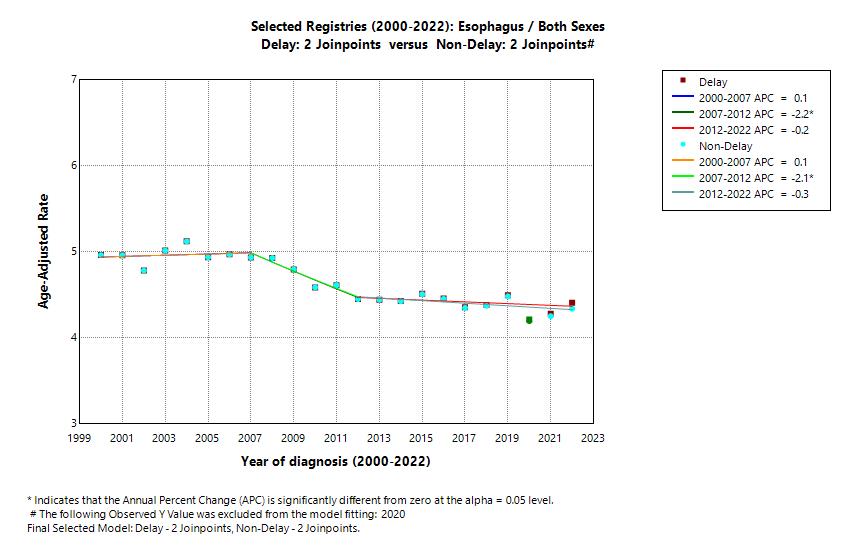
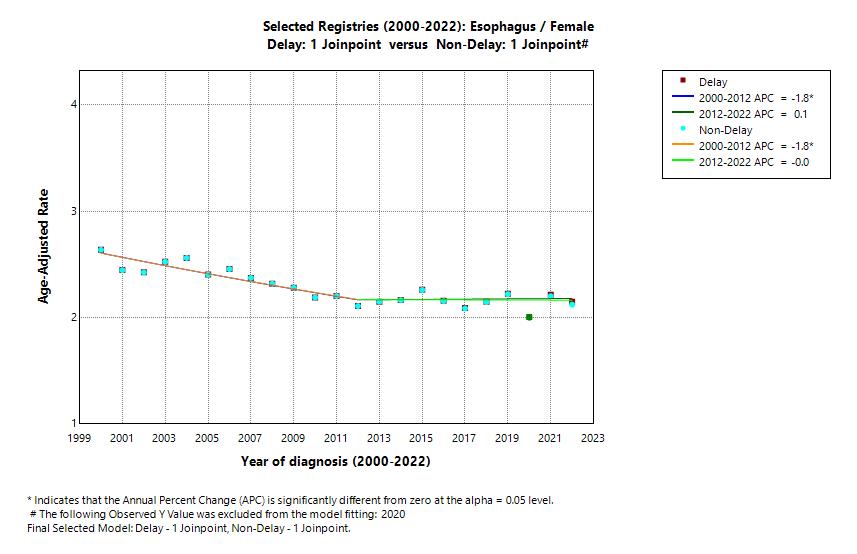
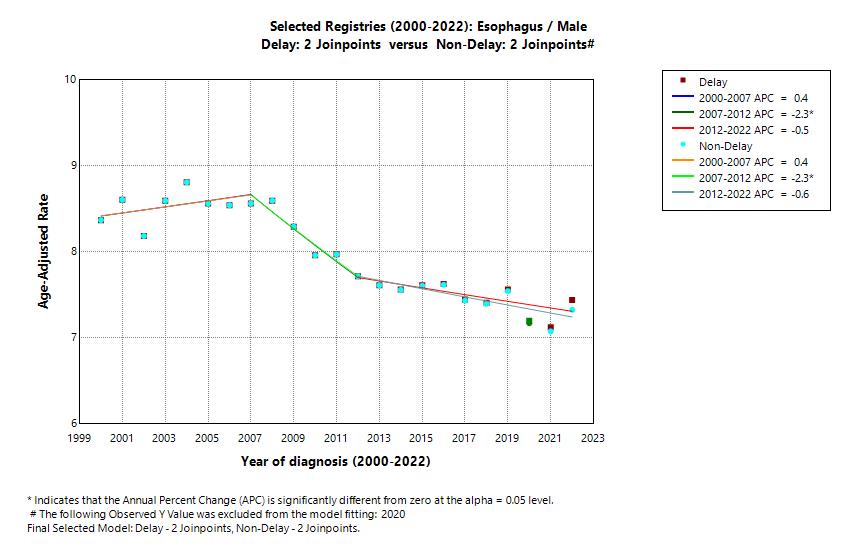
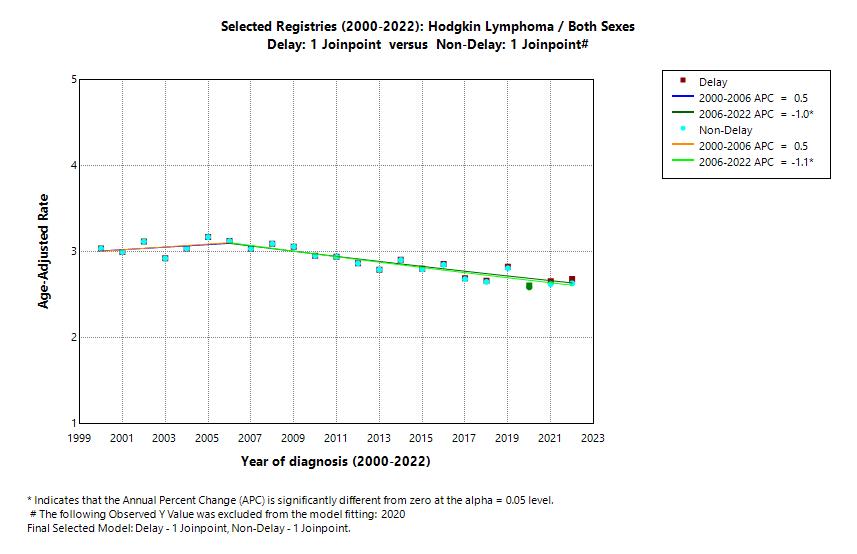
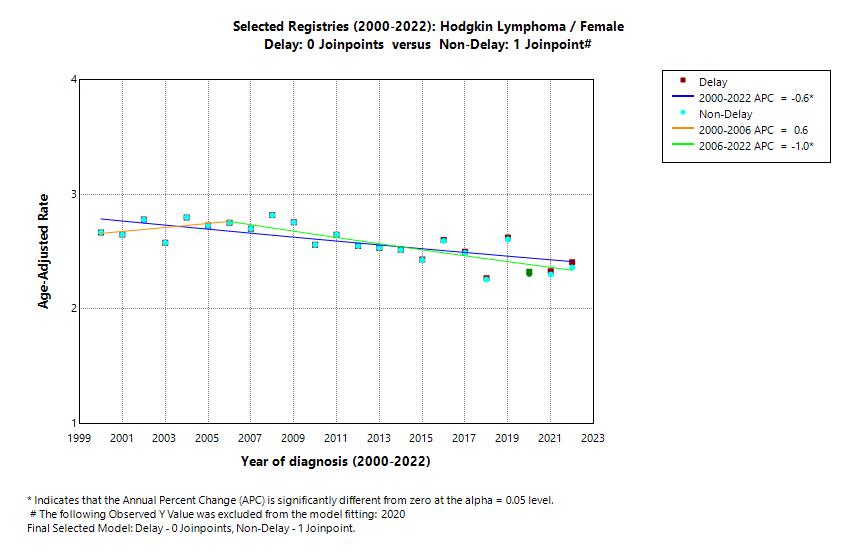
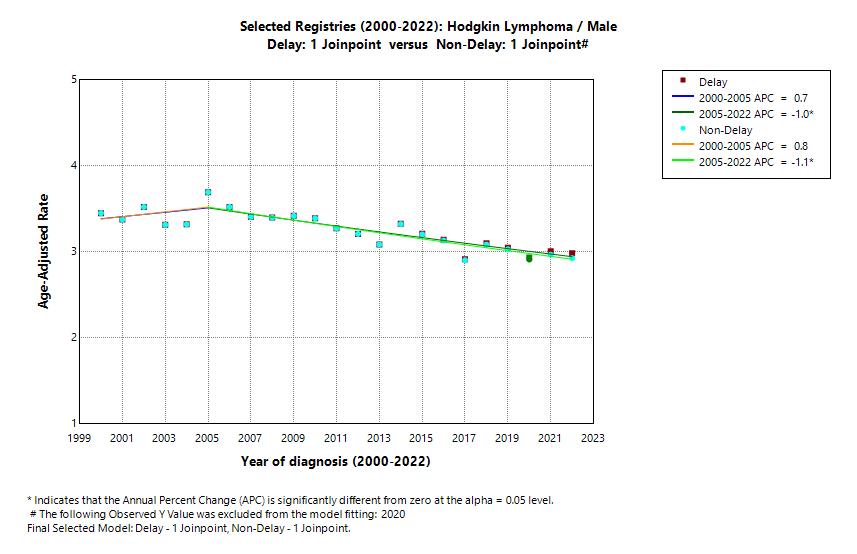
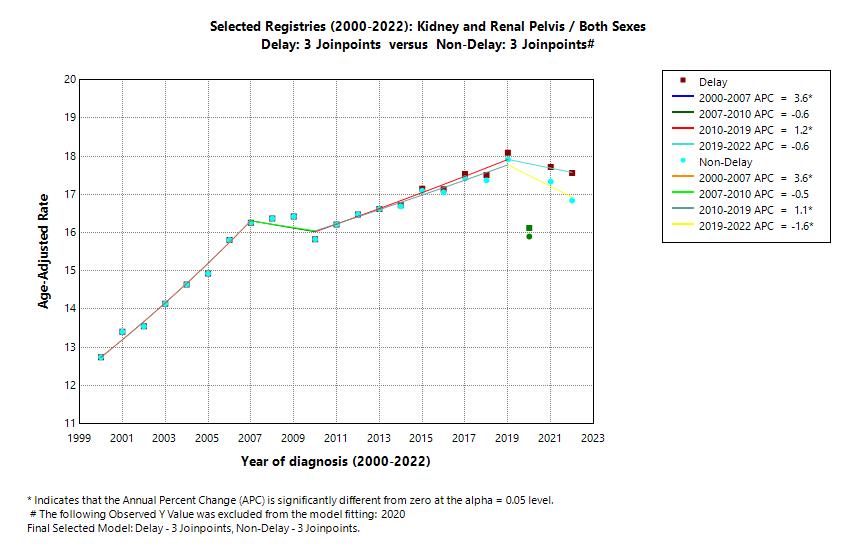
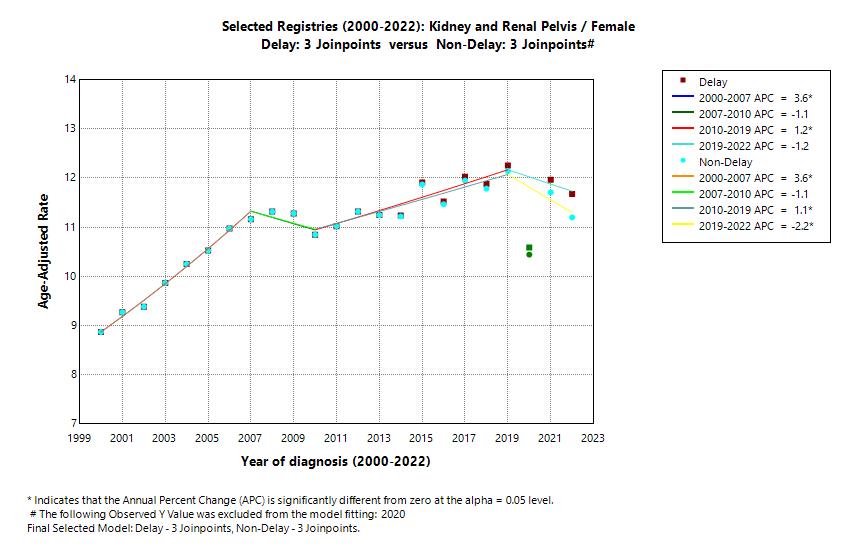
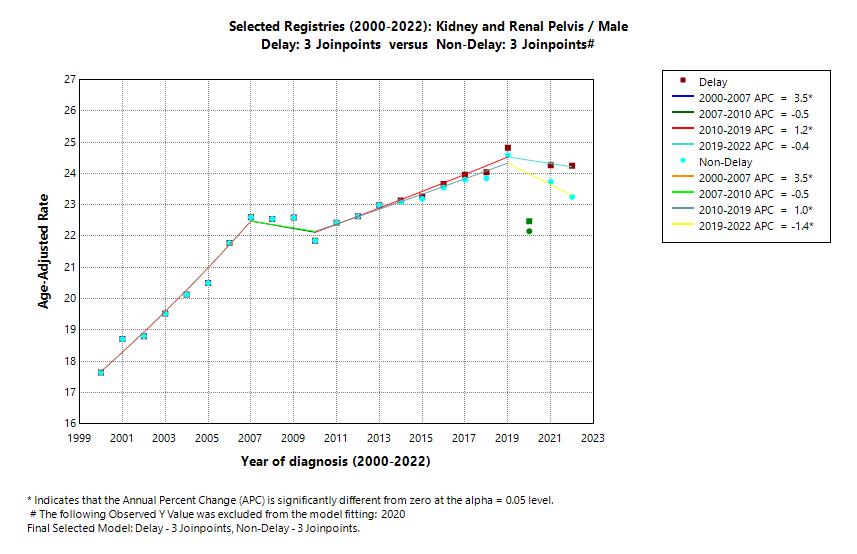
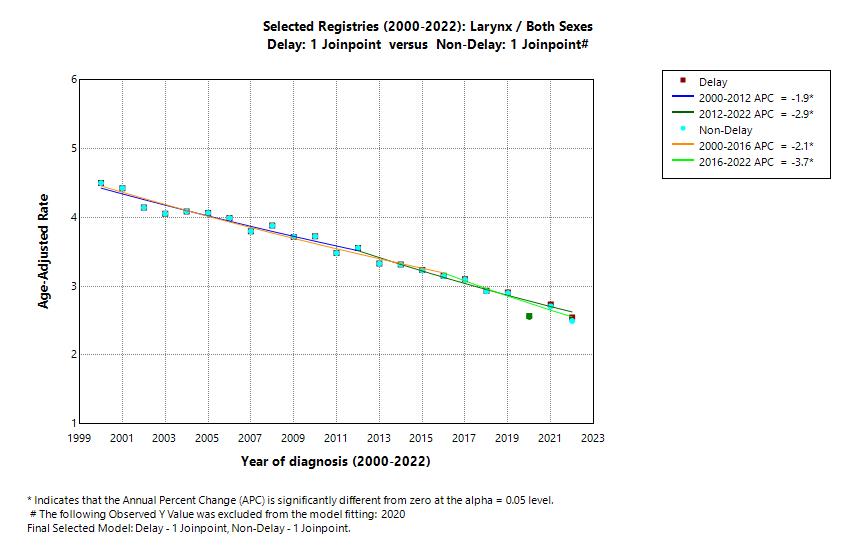
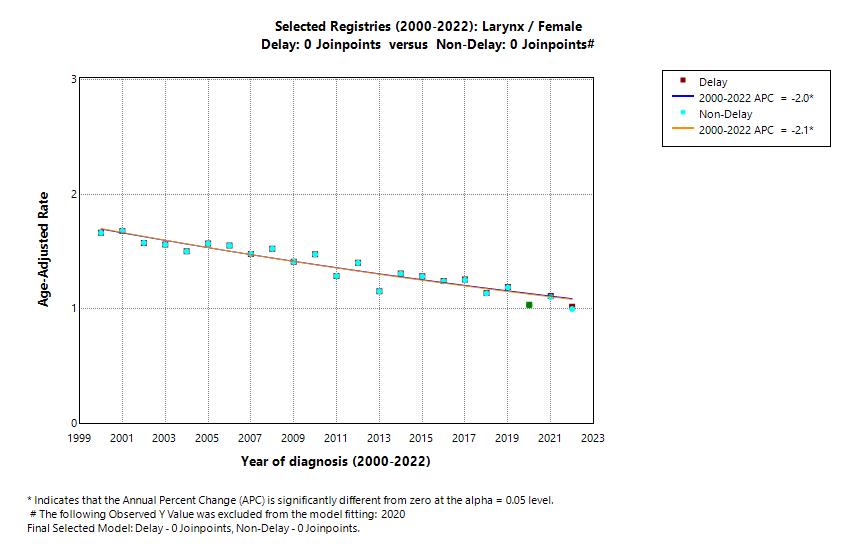
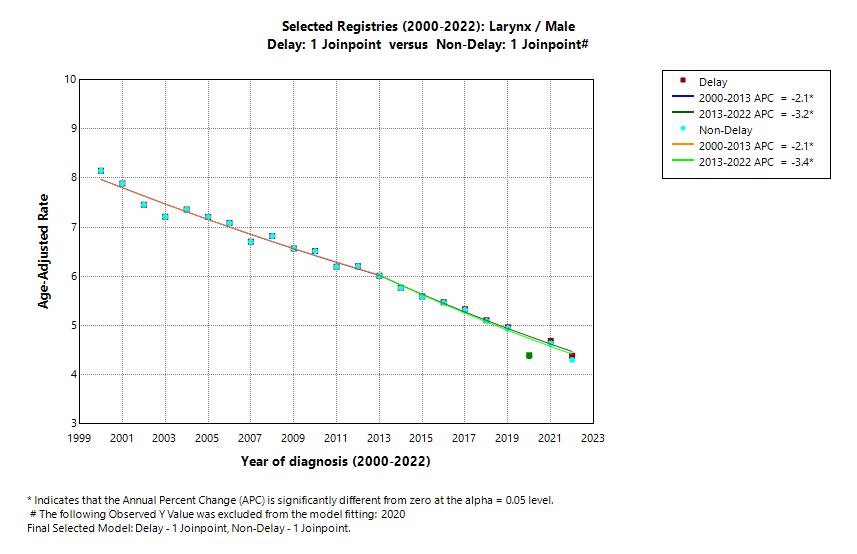
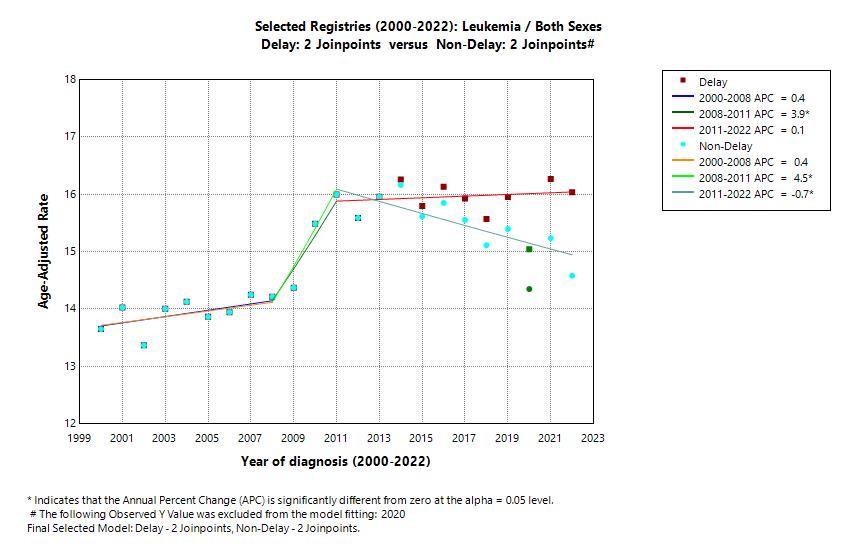
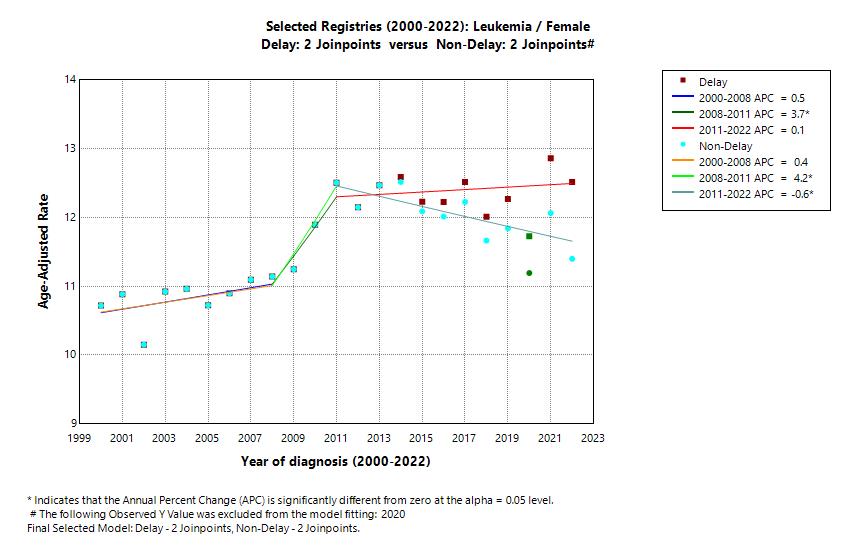
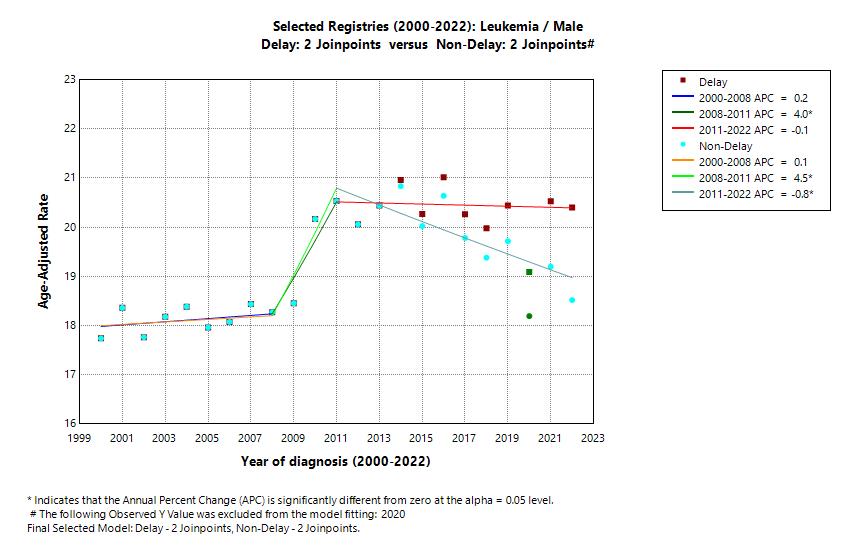
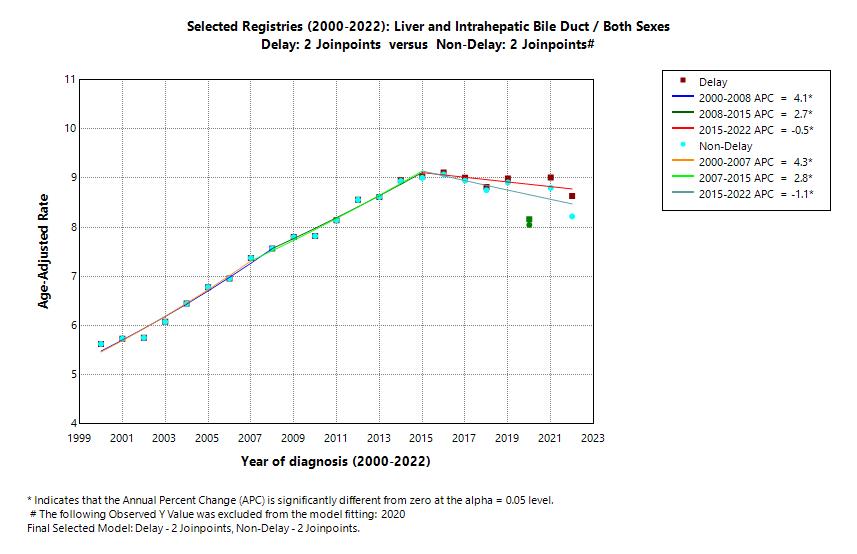
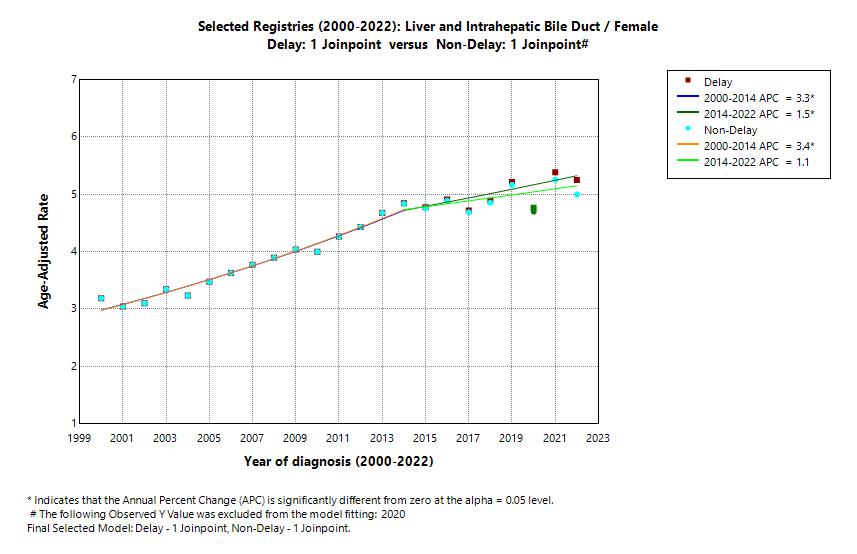
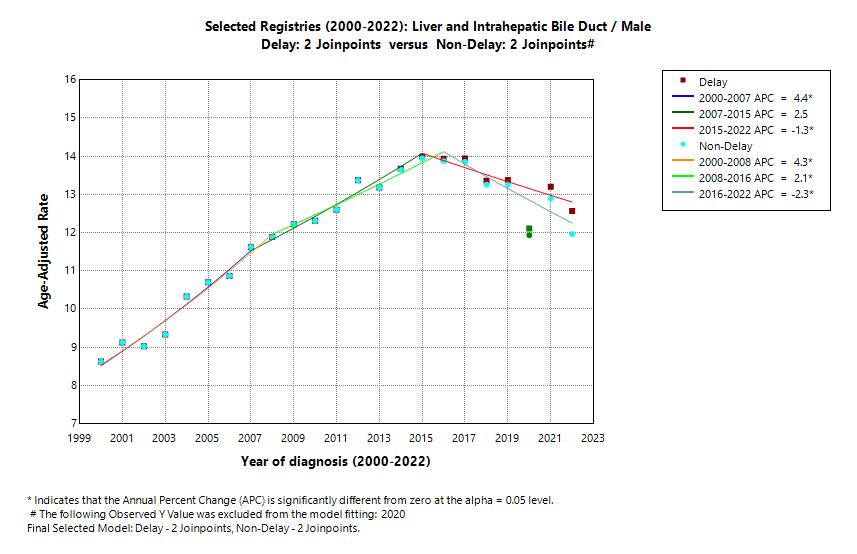
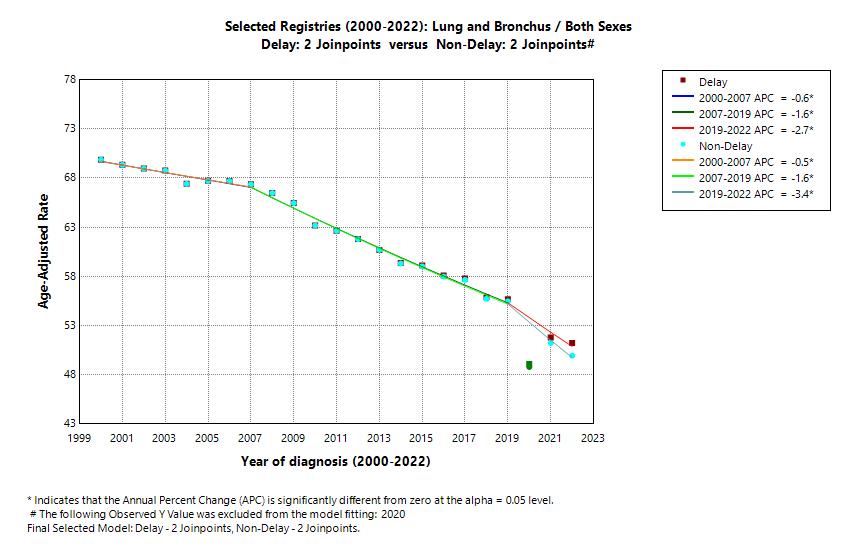
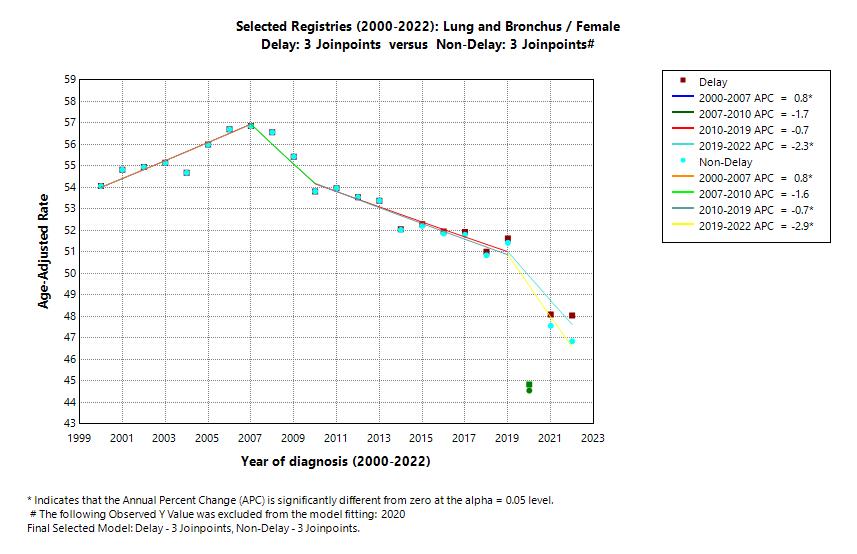
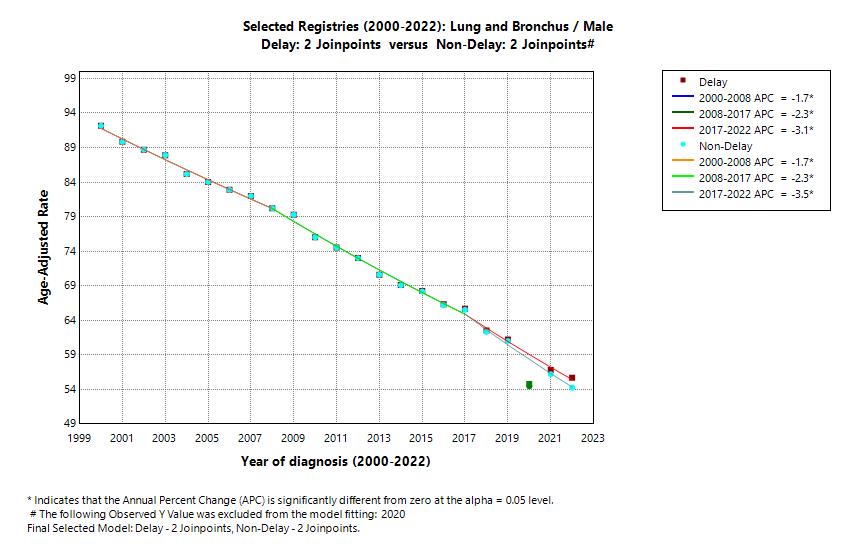
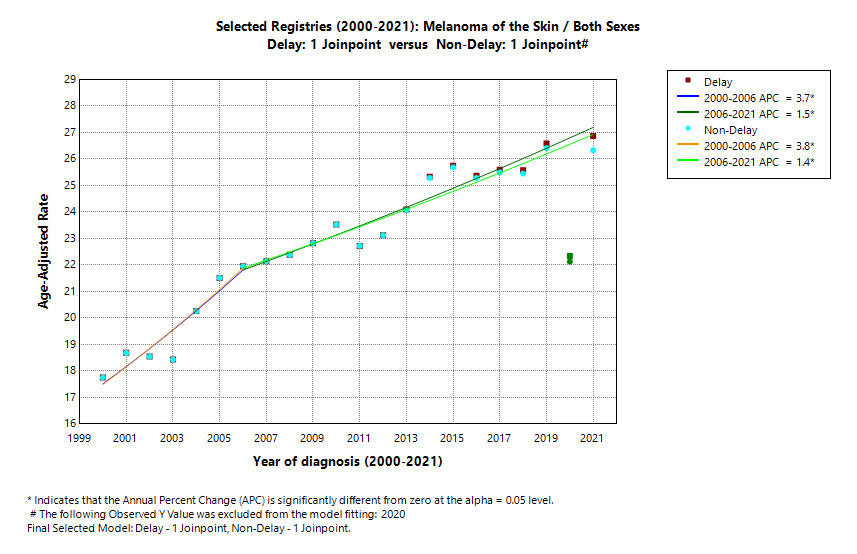
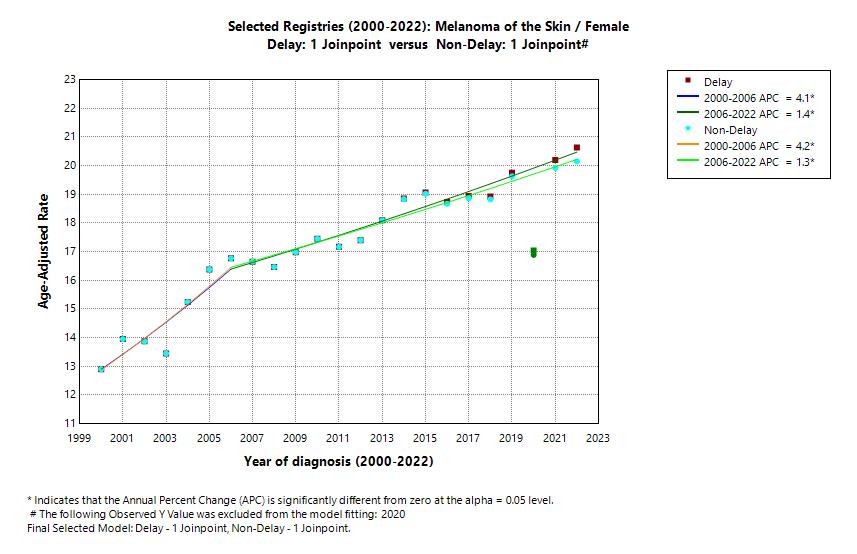
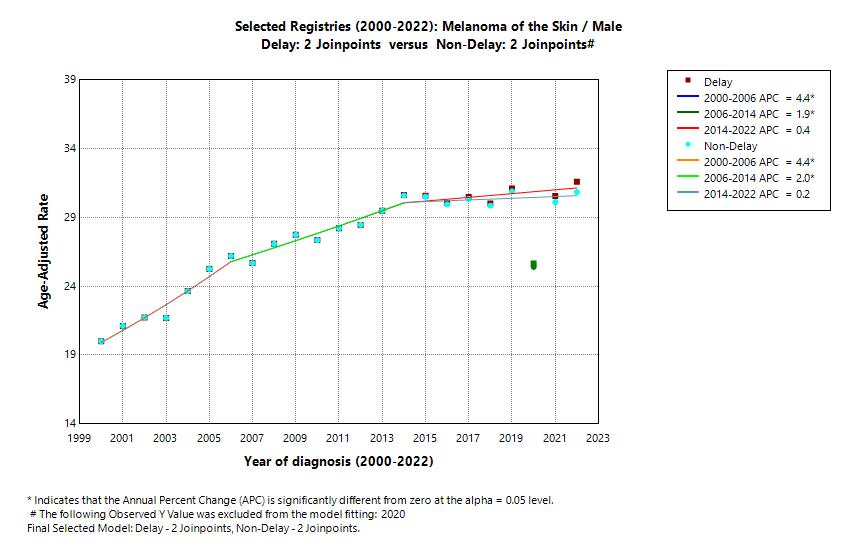
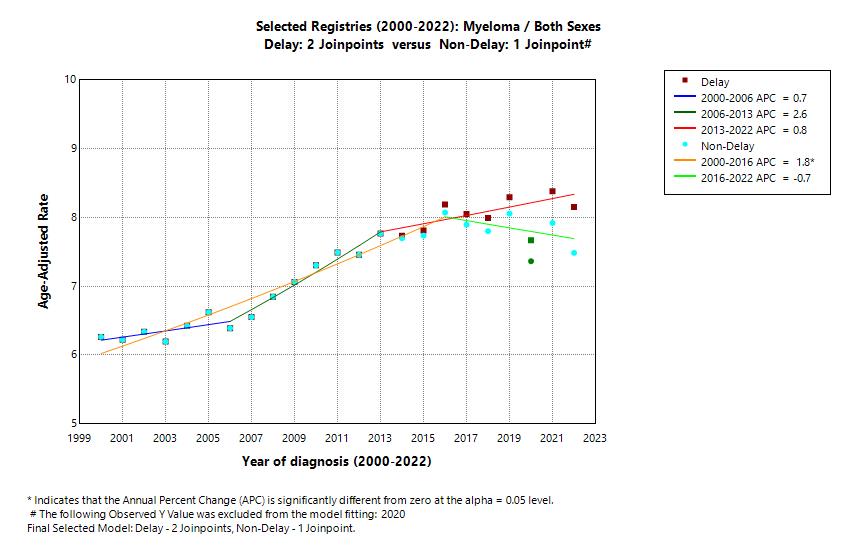
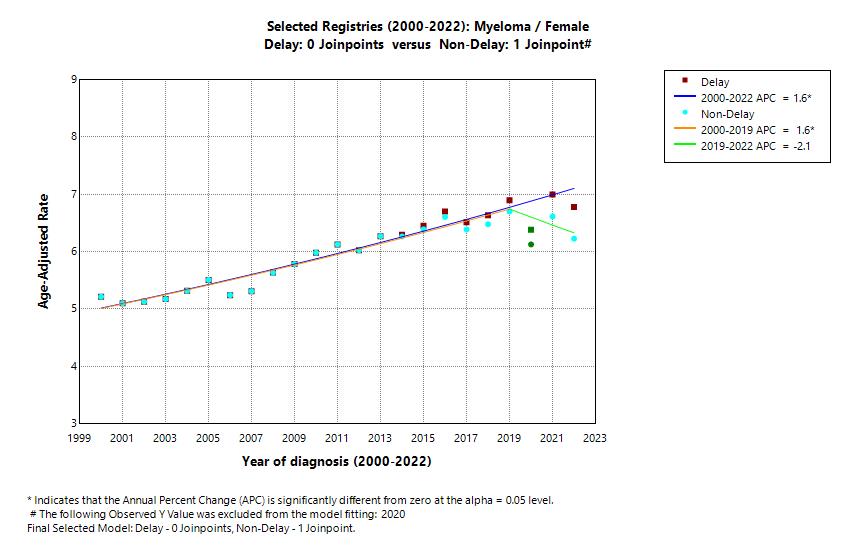
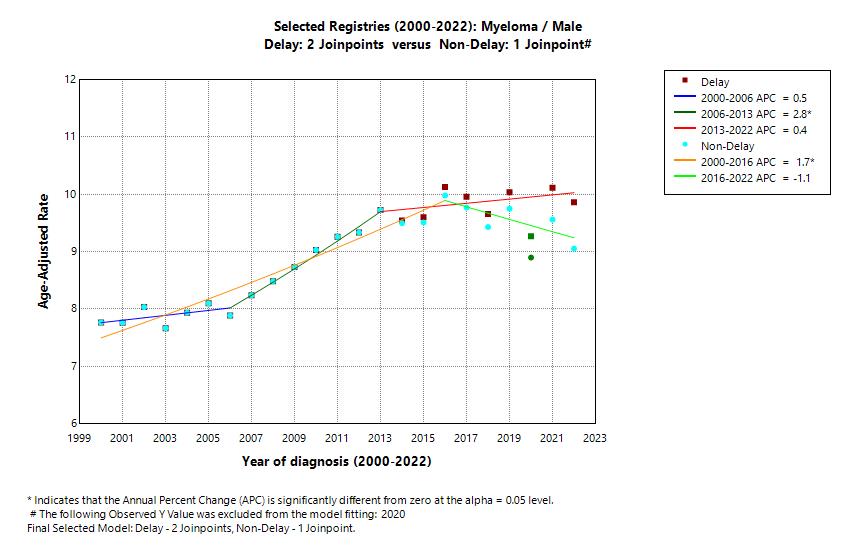
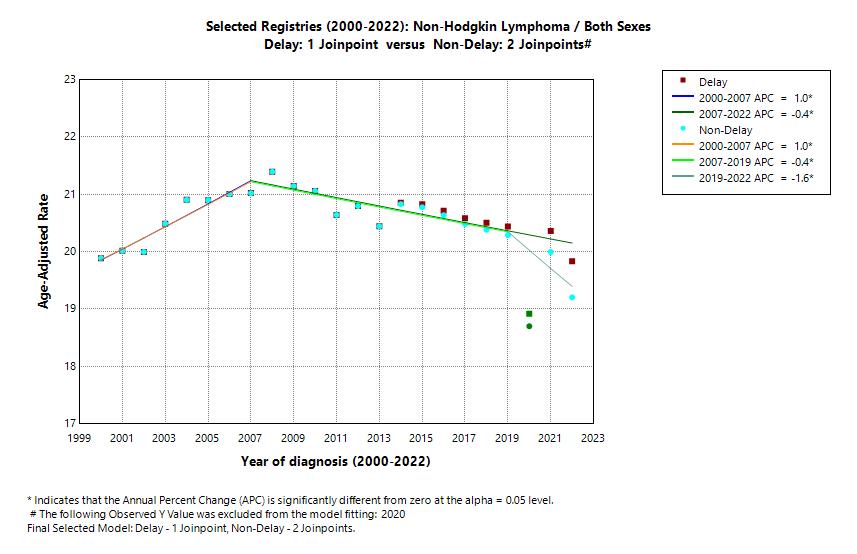
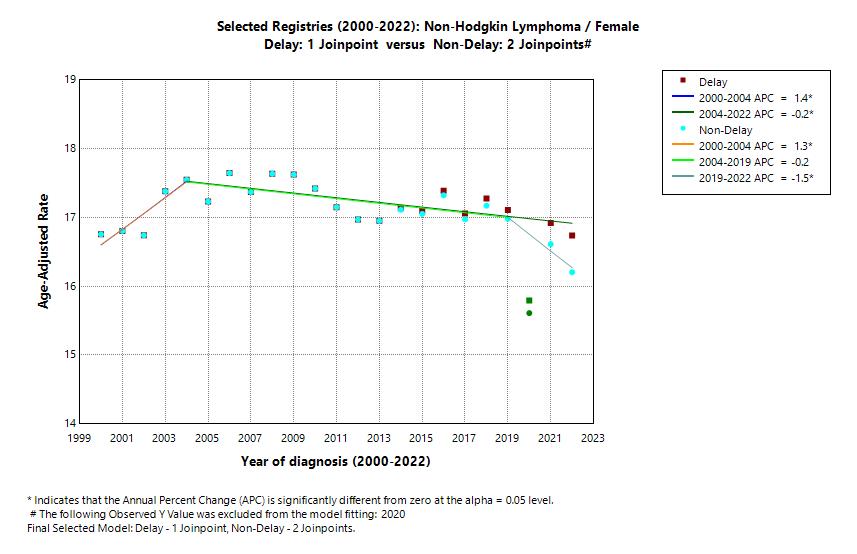
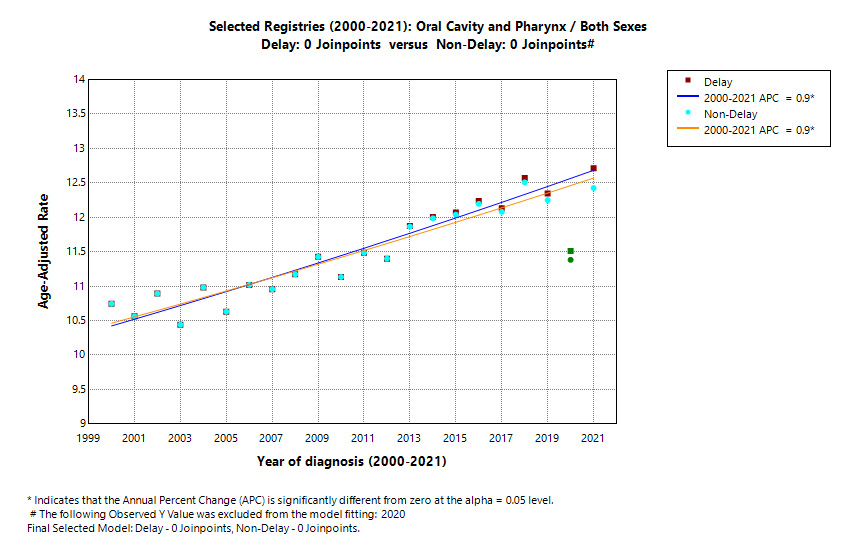
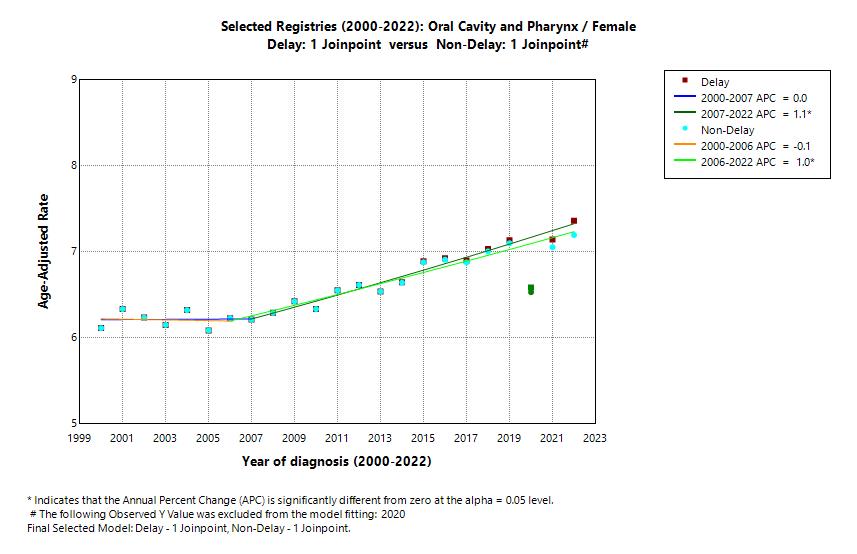
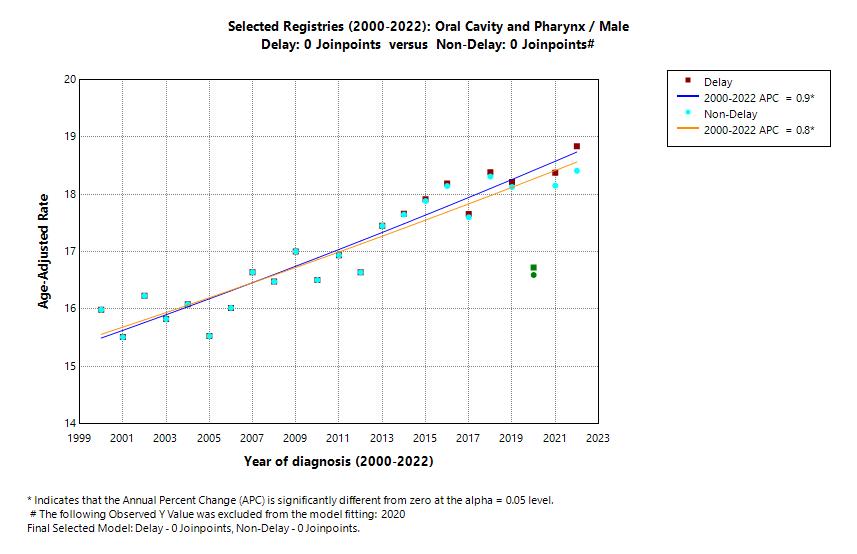
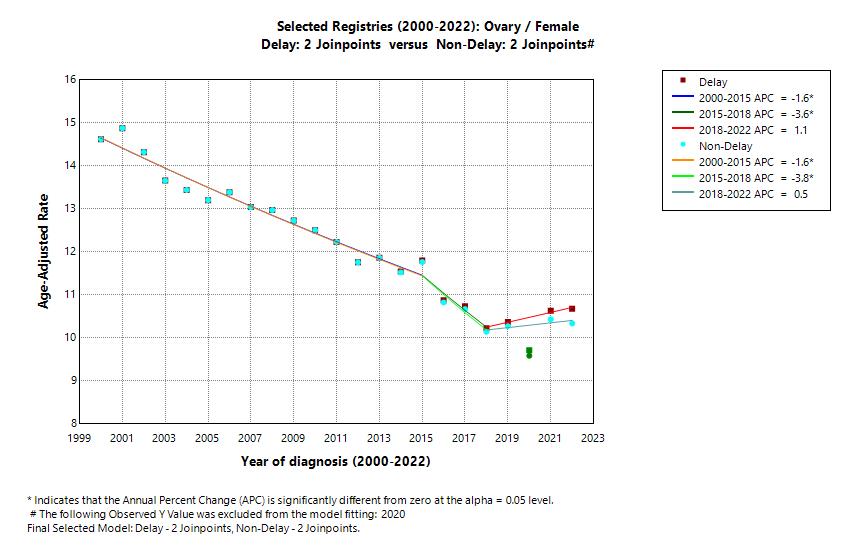
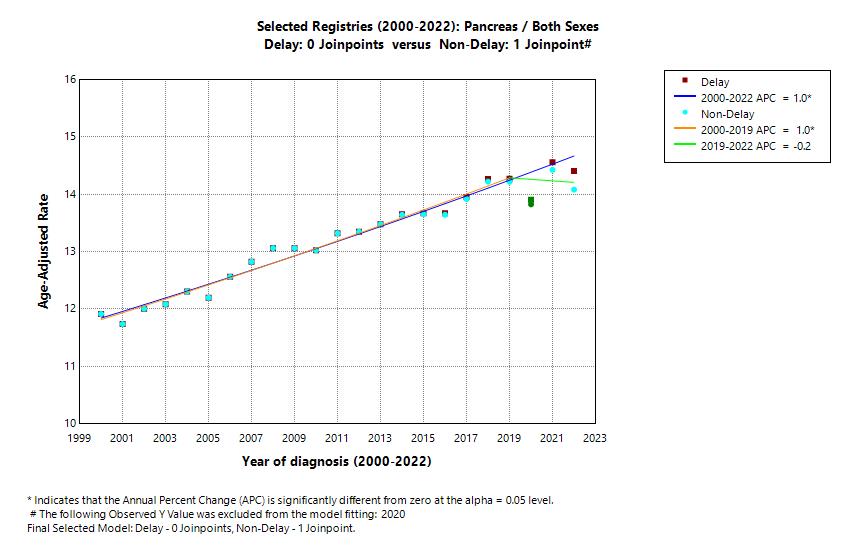
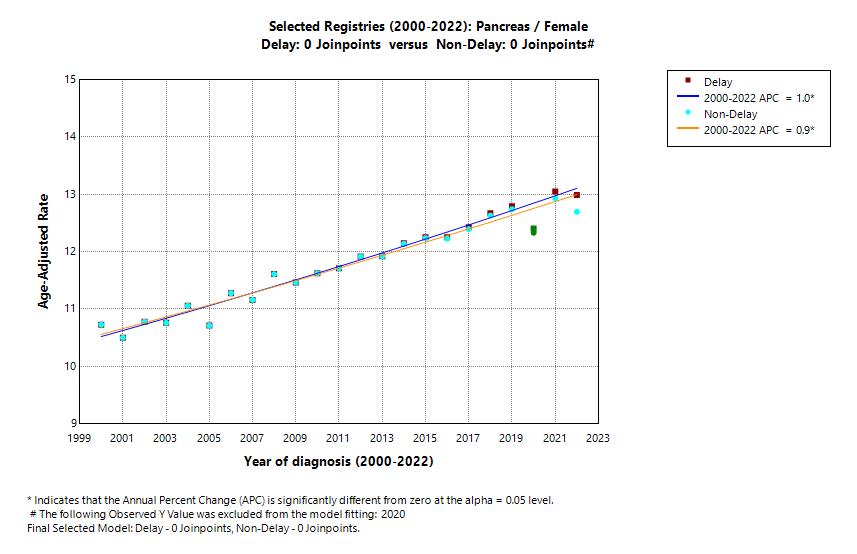
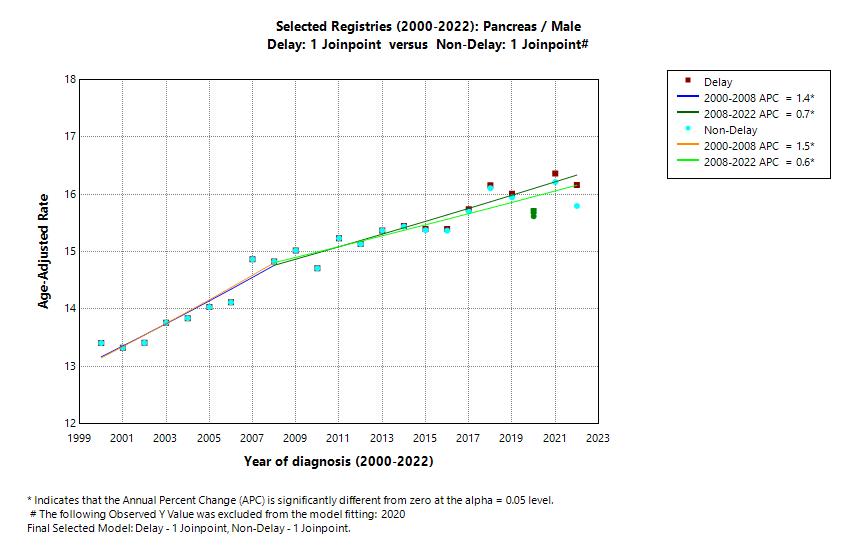
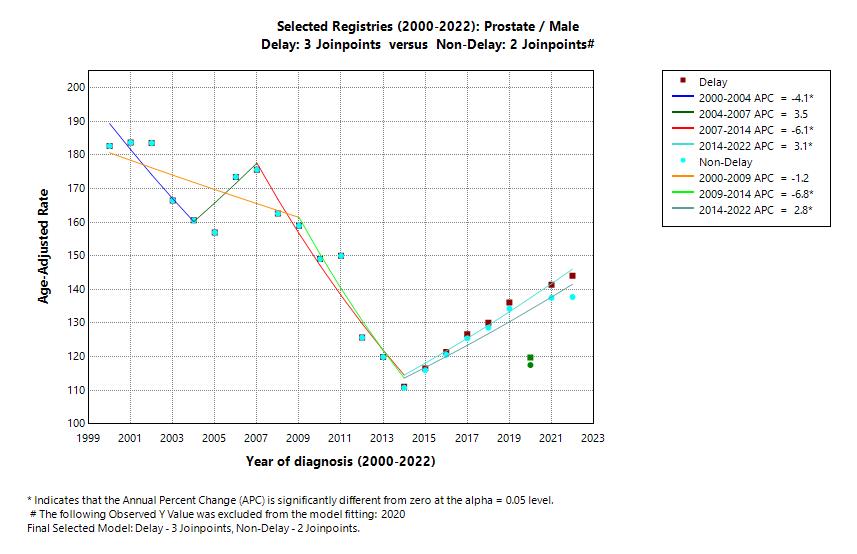
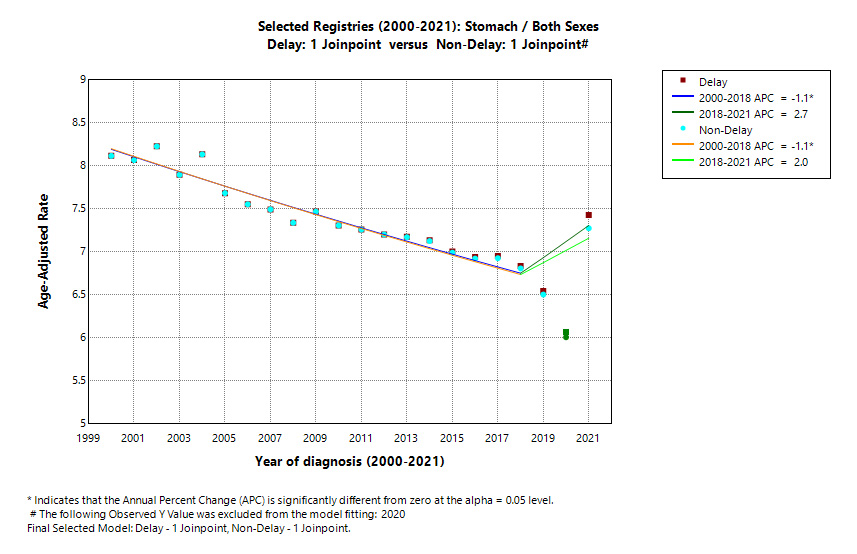
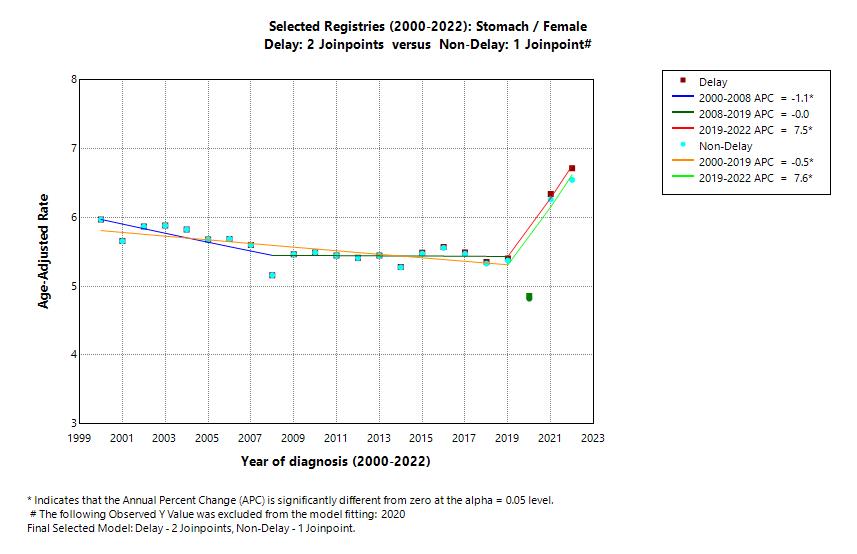
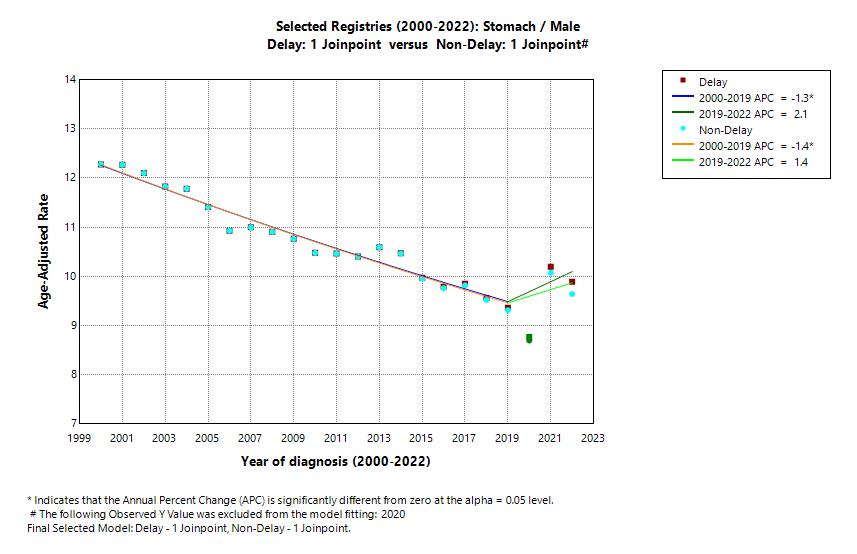
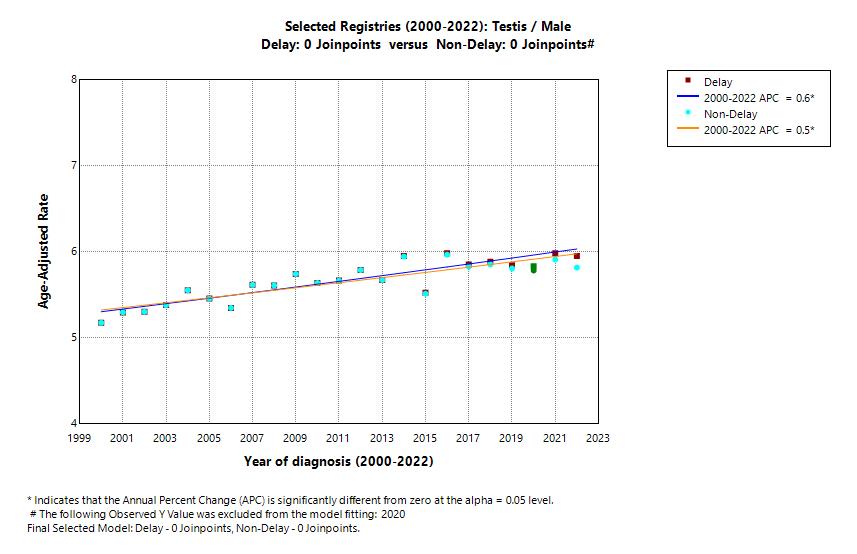
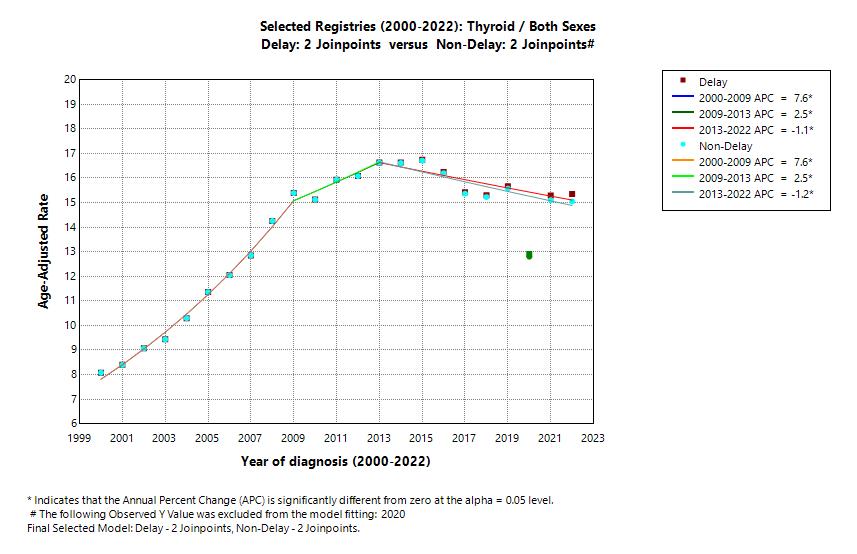
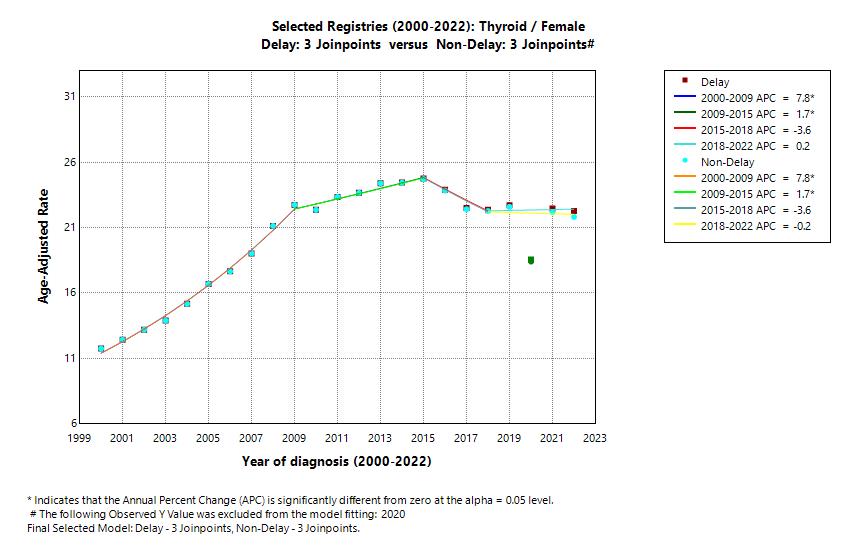
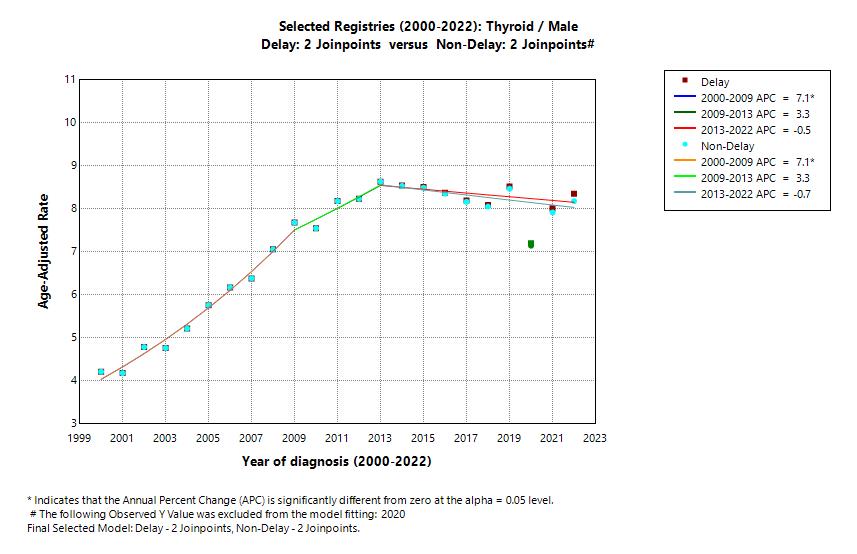
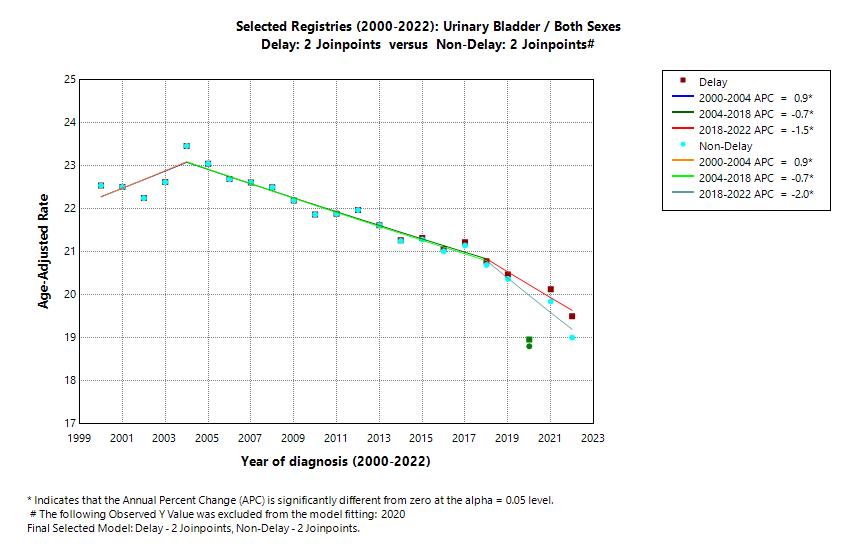
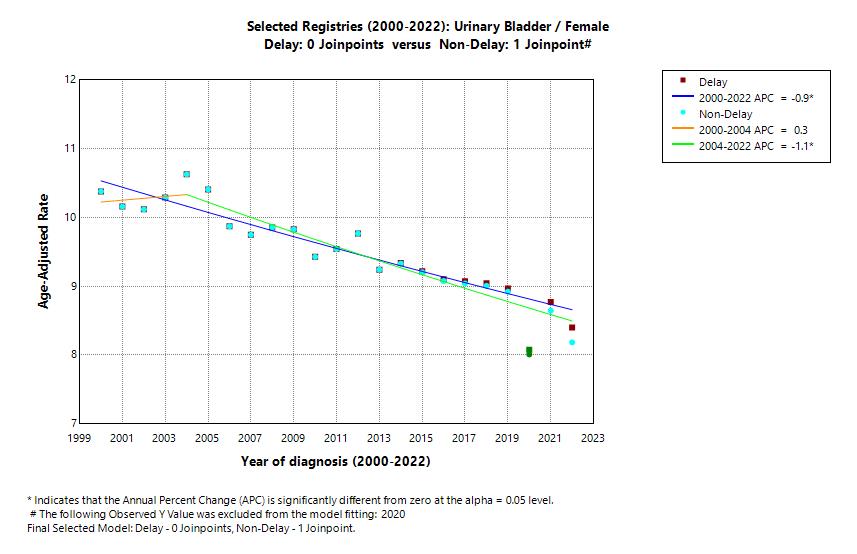
- Graph 2: Selected Registries (2000-2023)
Estimates based on the November 2025 data submission and limited to the same registries included in the preliminary estimates.
By comparing the direction and statistical significance of the final Joinpoint segment for trends based on delay-adjusted rates between Graph1 and Graph 2, users can identify cancer site and sex combinations where the inclusion of the new 2024 incidence data suggests a change in the trend for this cancer for the selected registries. Of the 60 cancer site and sex combinations, there were 7 instances where a new trend was suggested. Caution is advised, as these trends may not be confirmed when the official November 2026 data are released in April 2027.
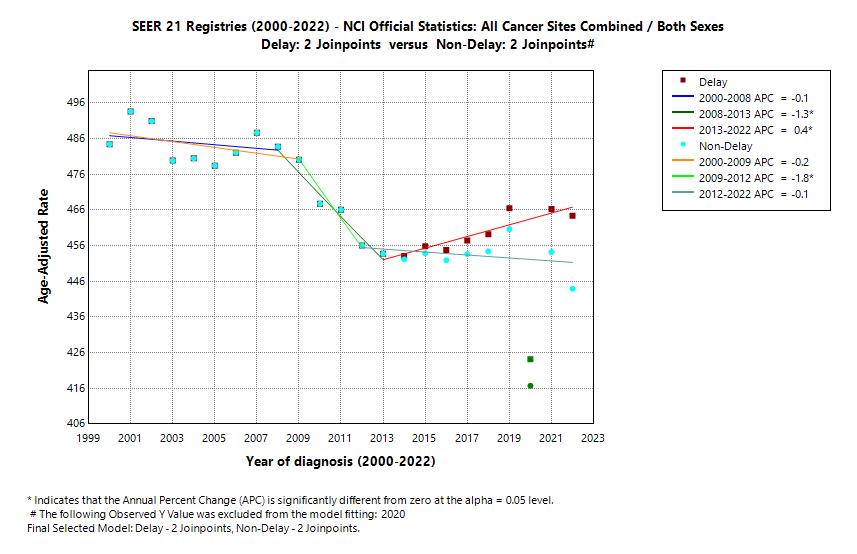
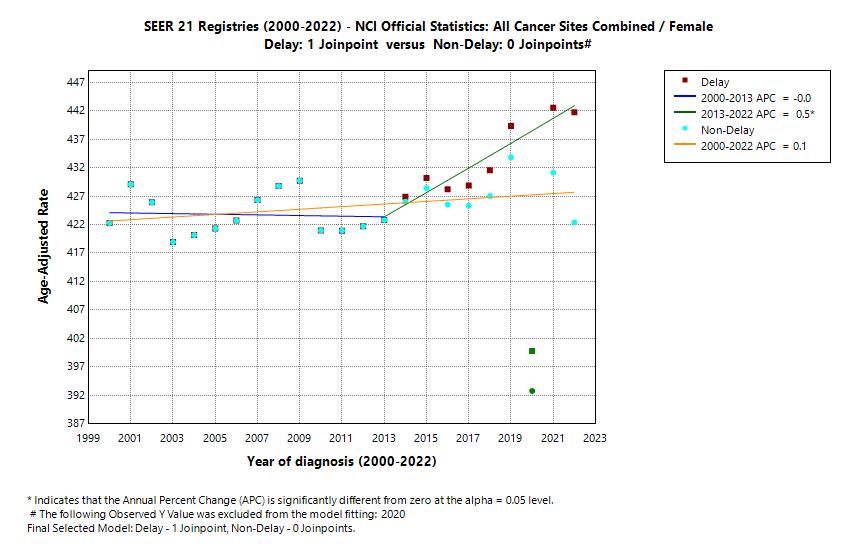
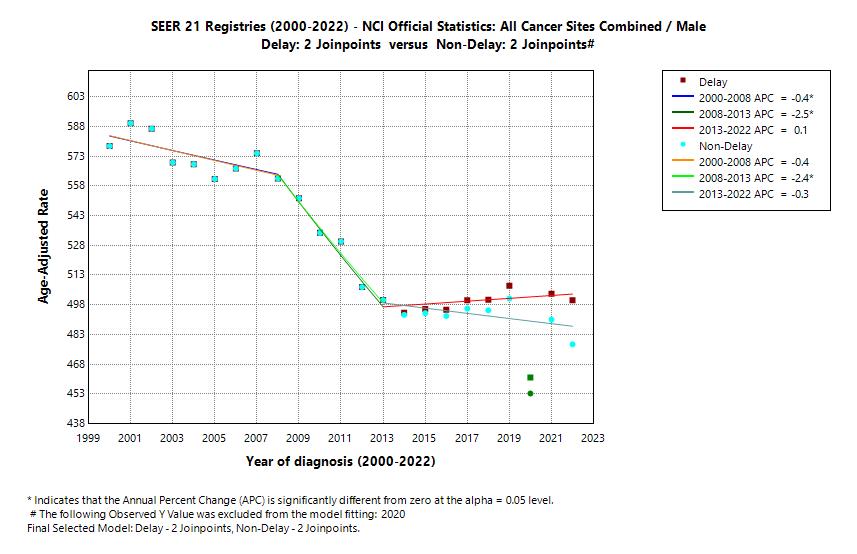
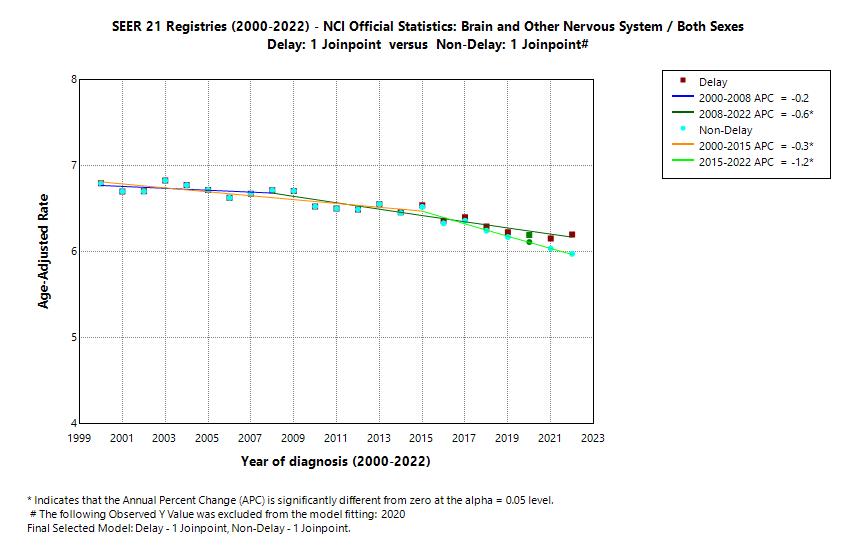
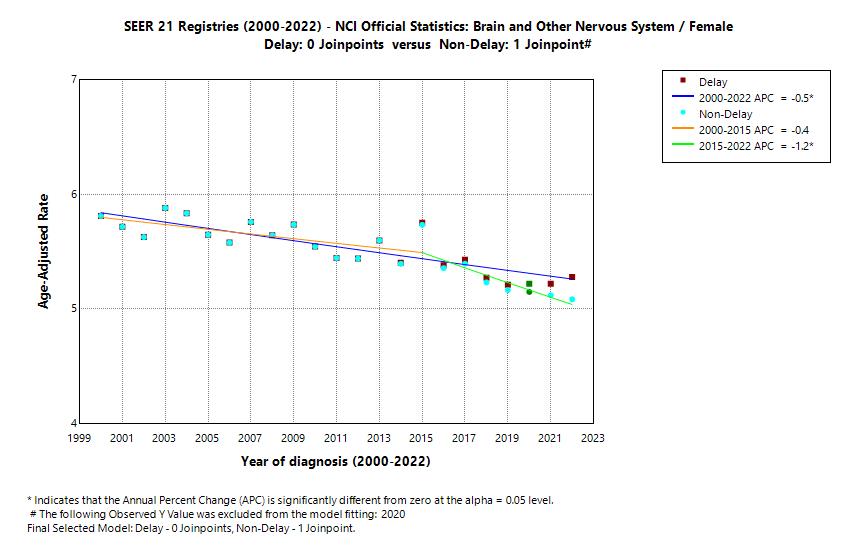
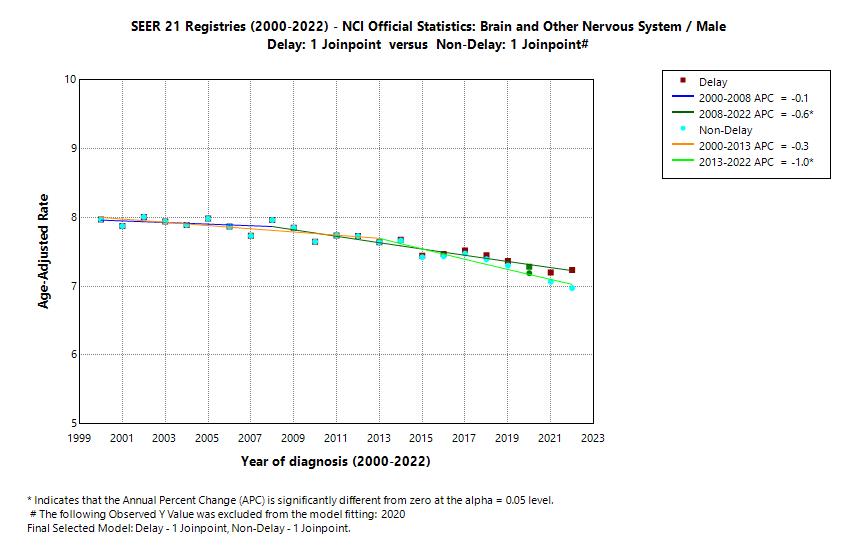
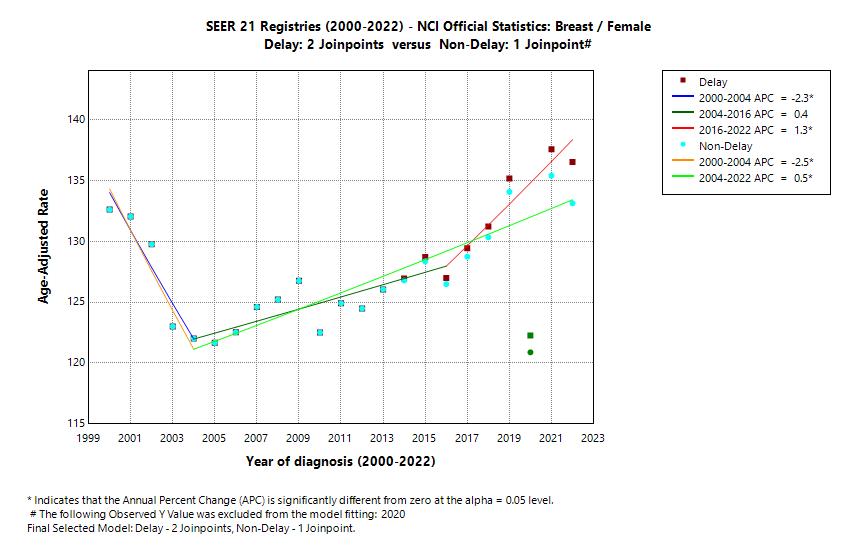
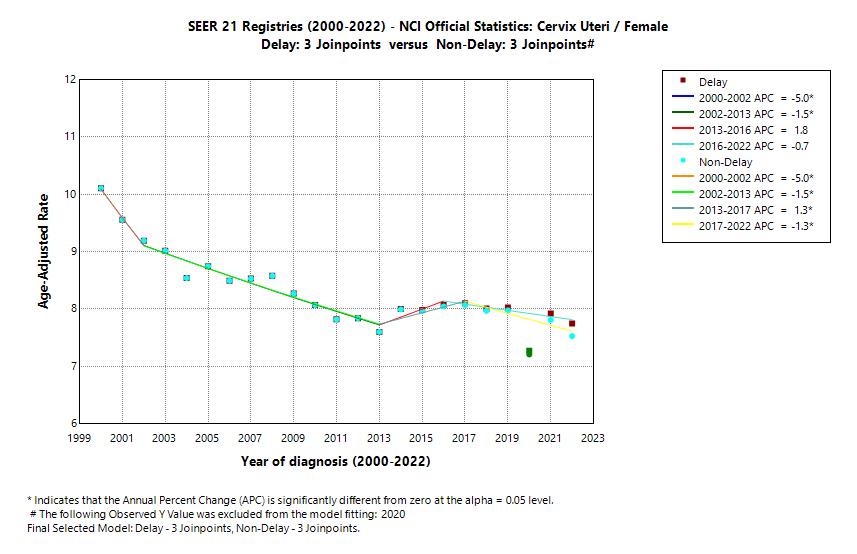
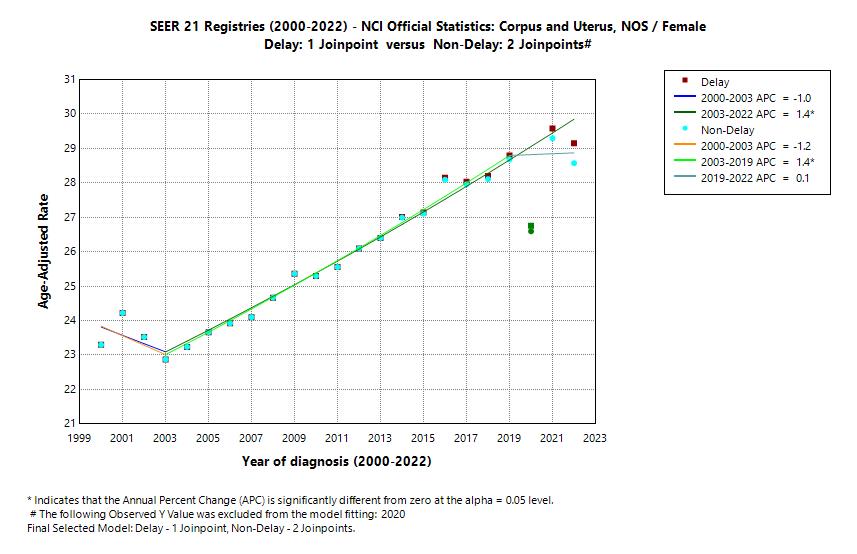
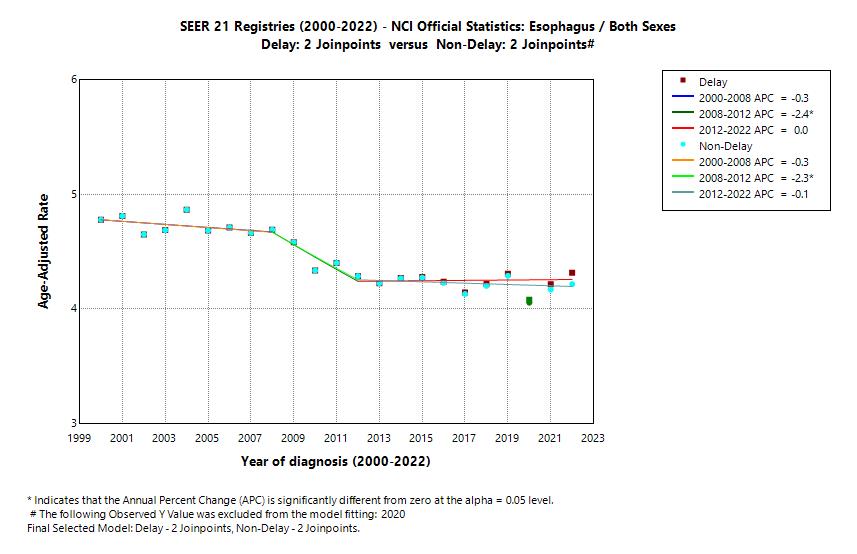
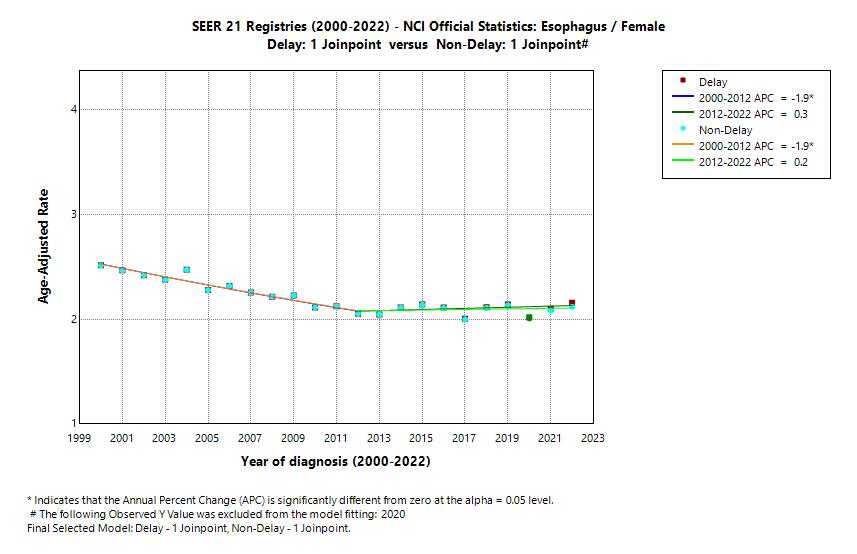
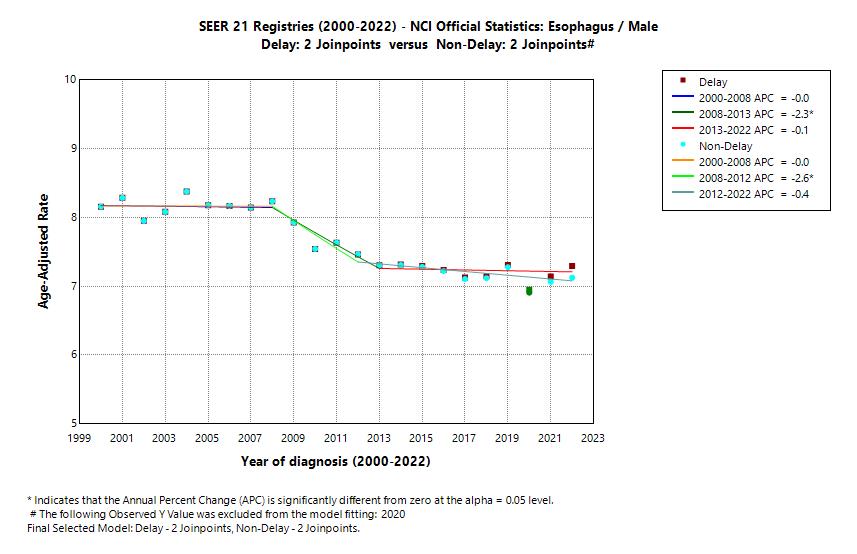
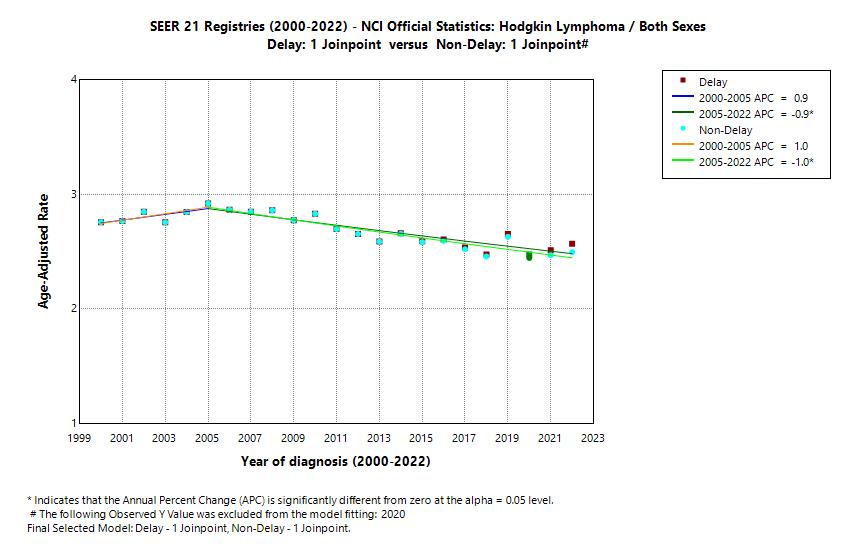
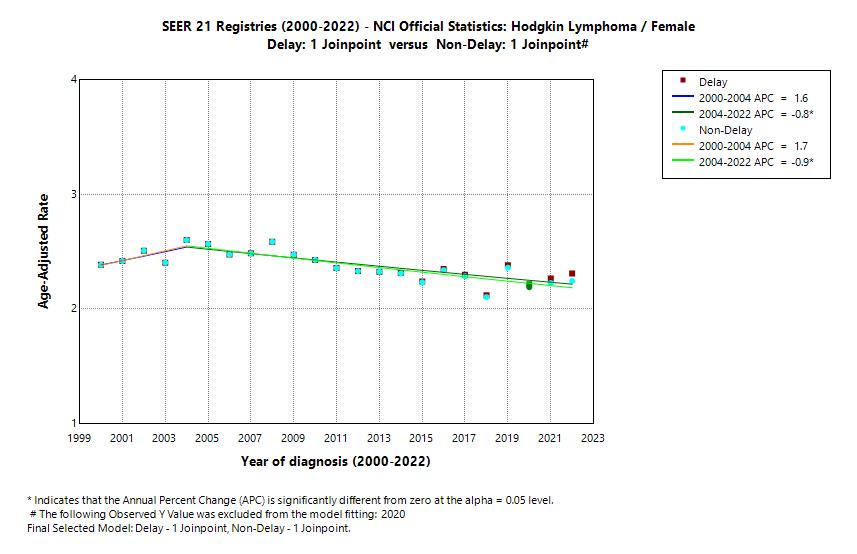
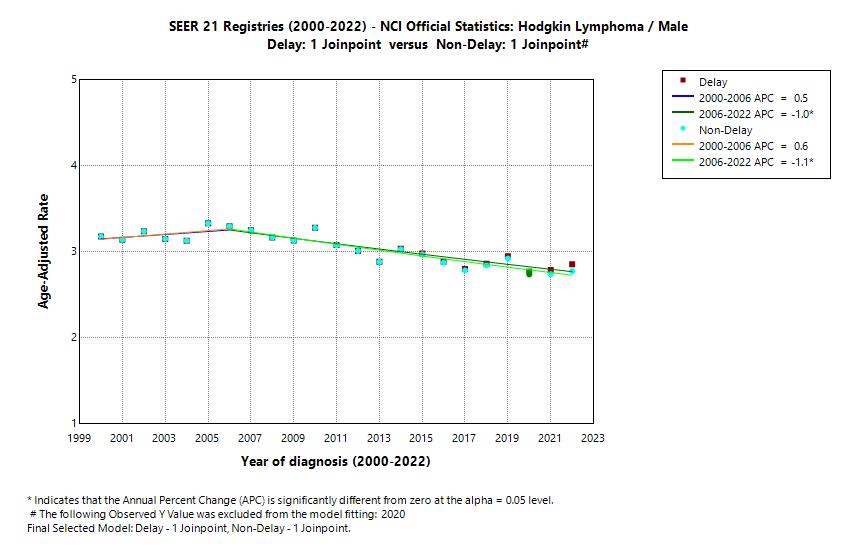
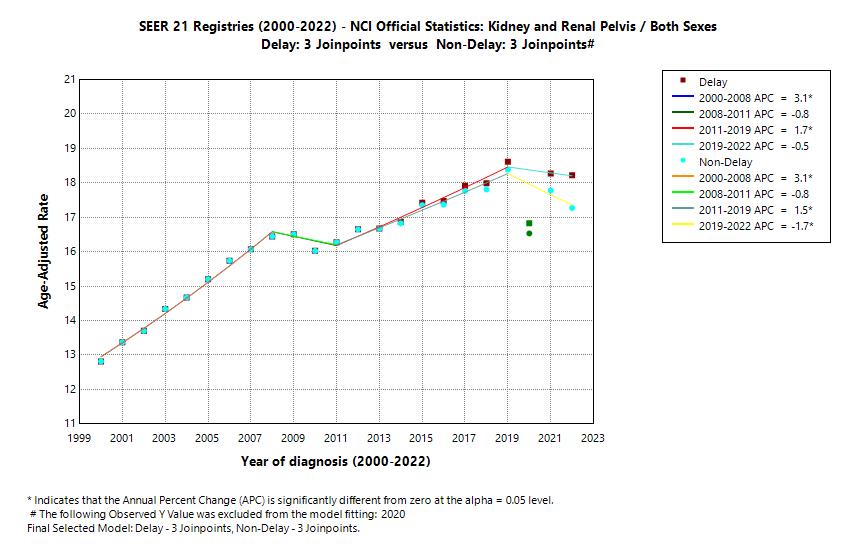
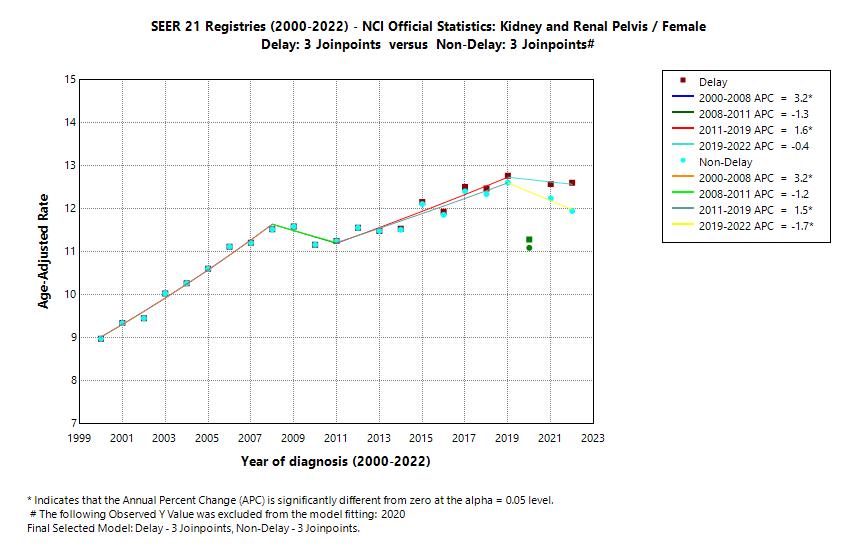
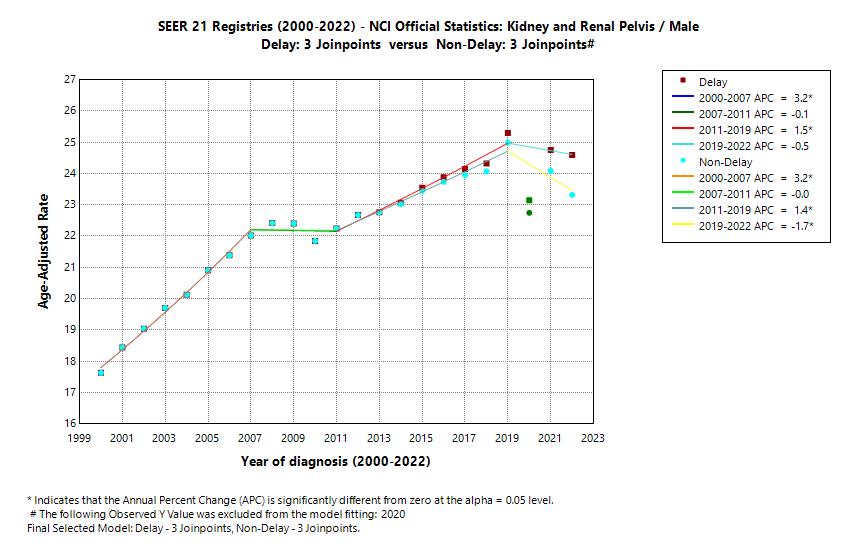
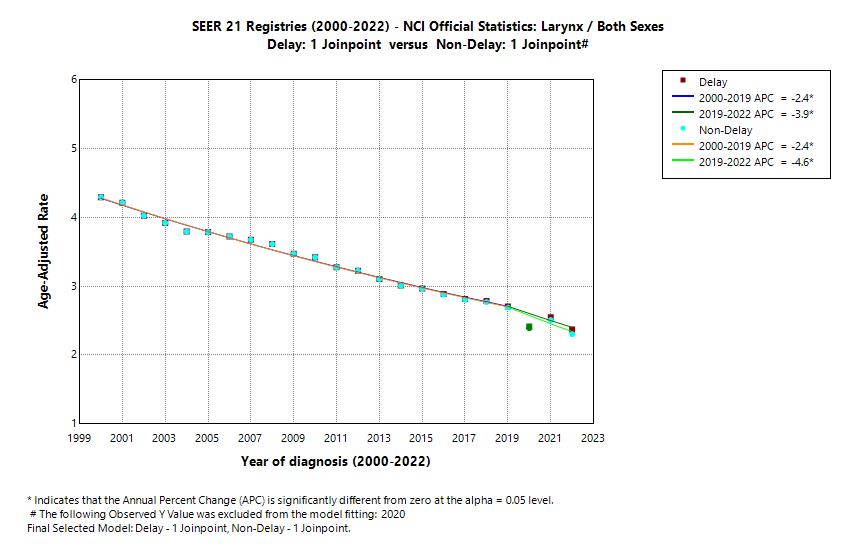
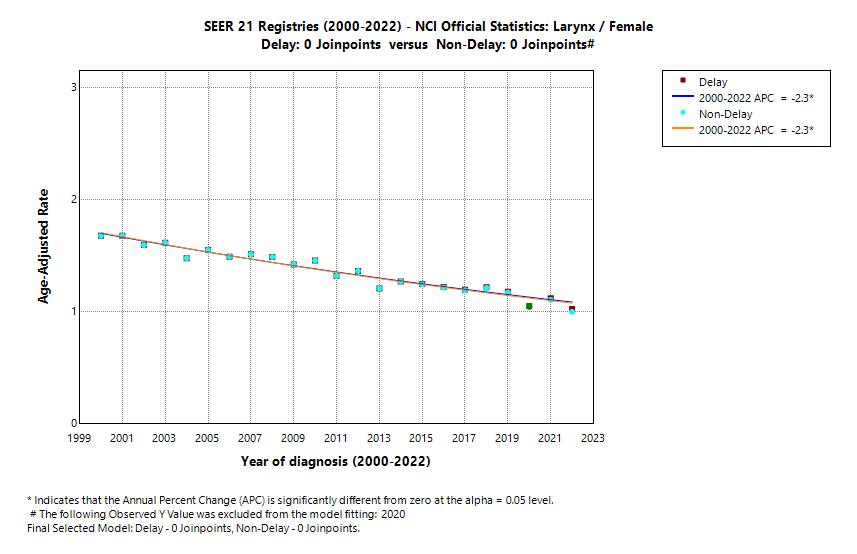
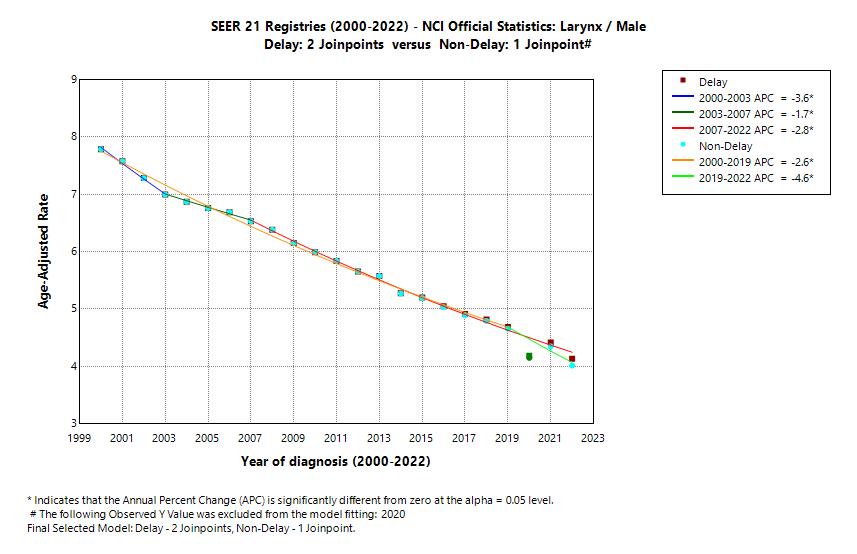
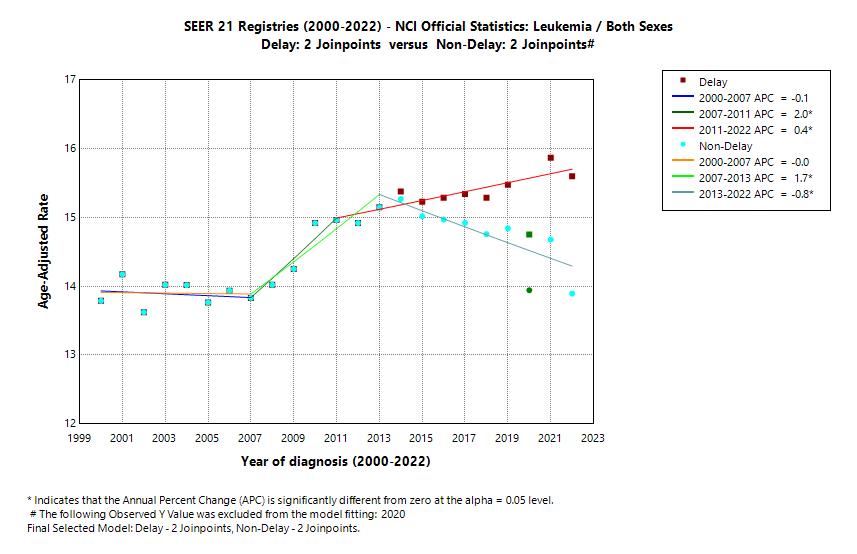
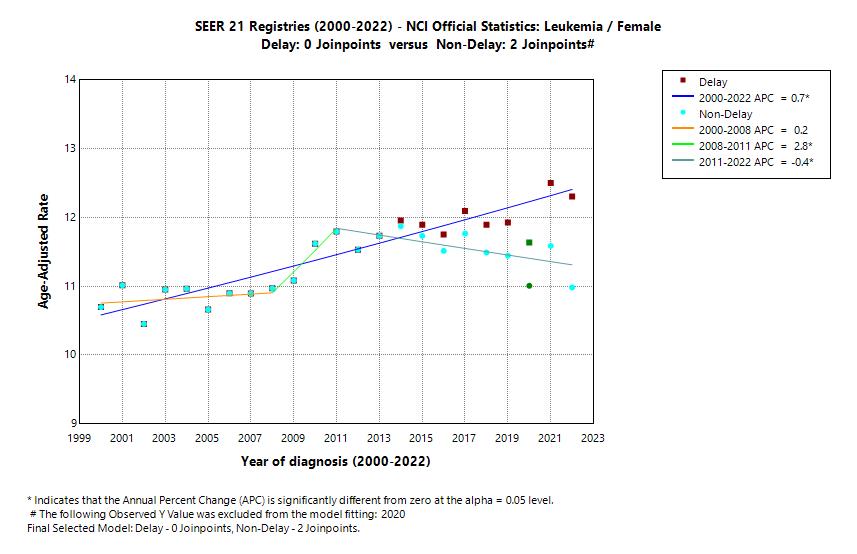
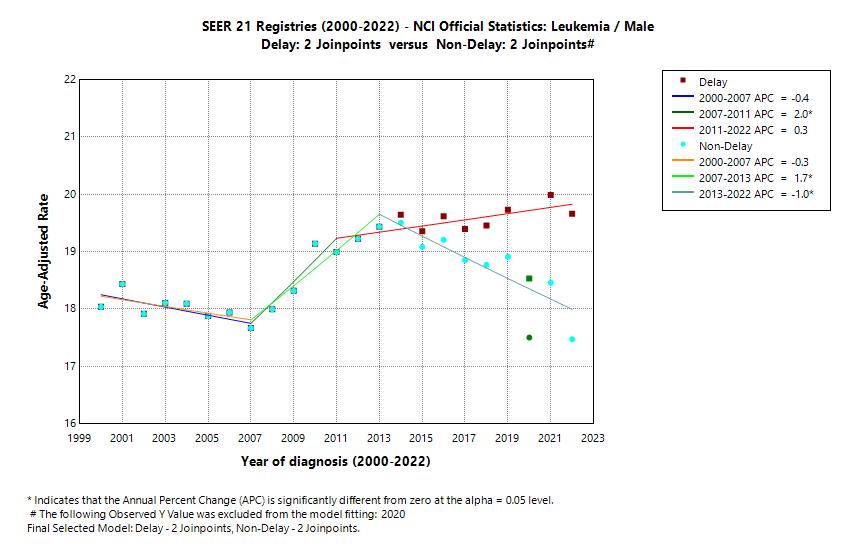
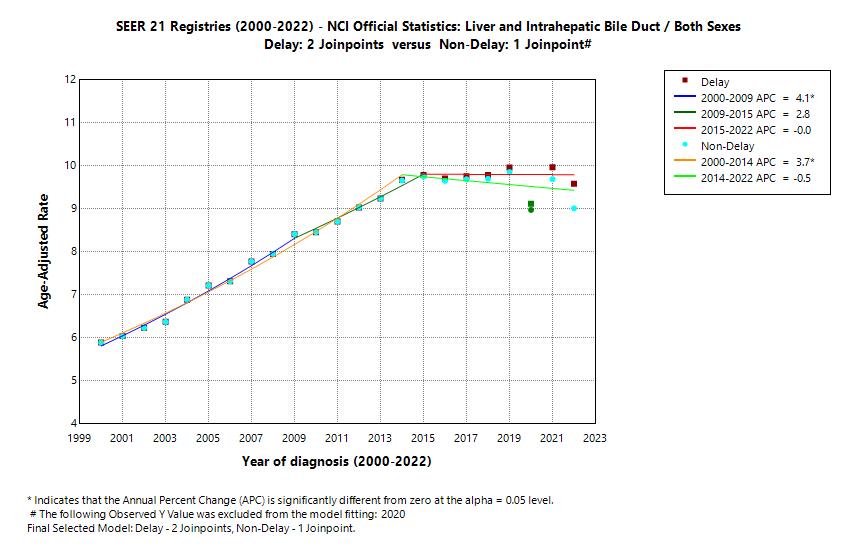
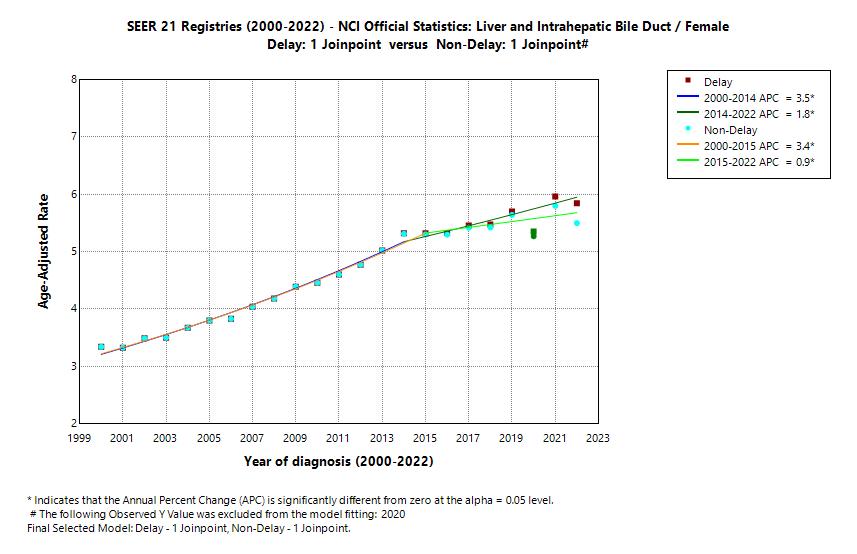
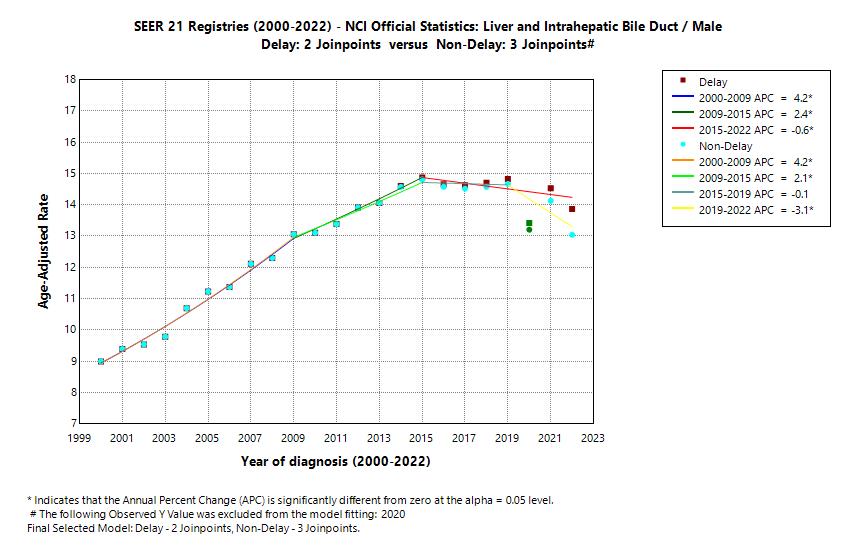
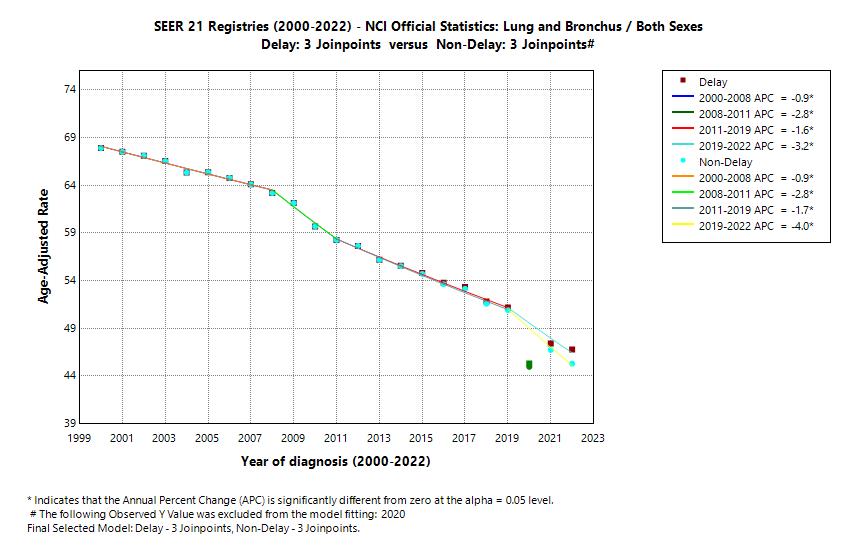
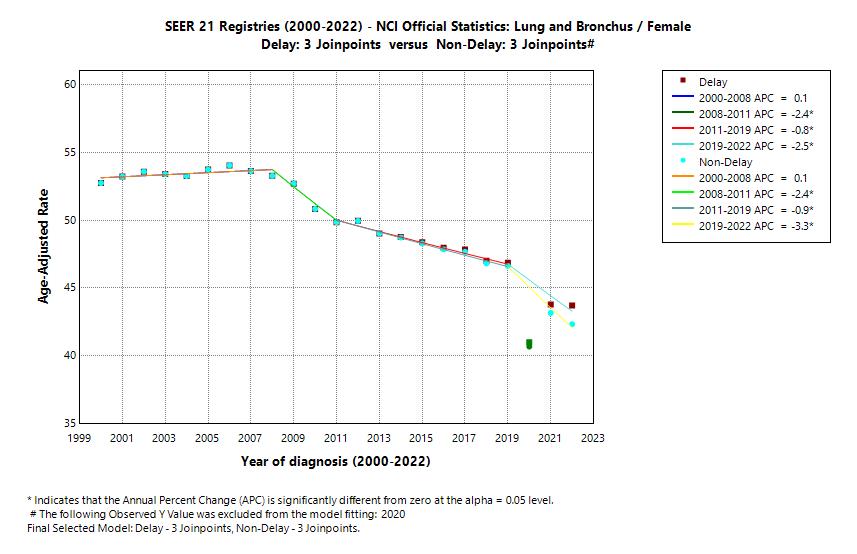
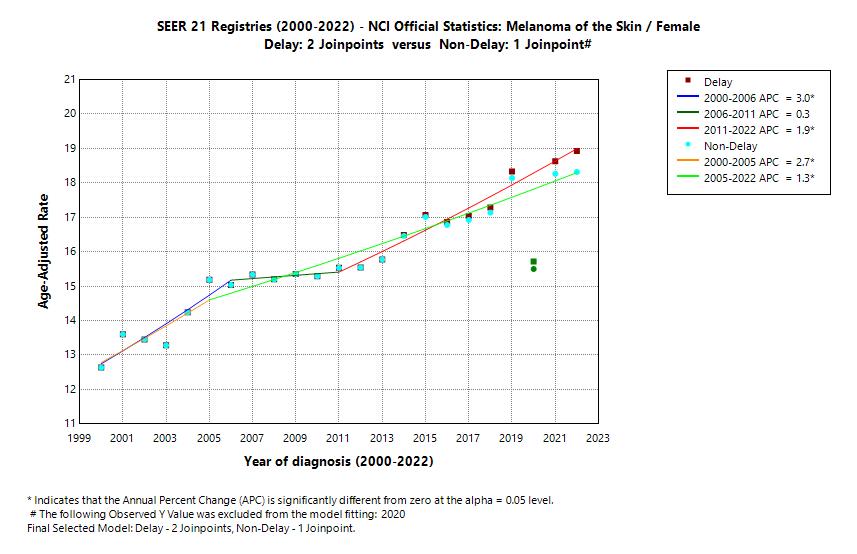
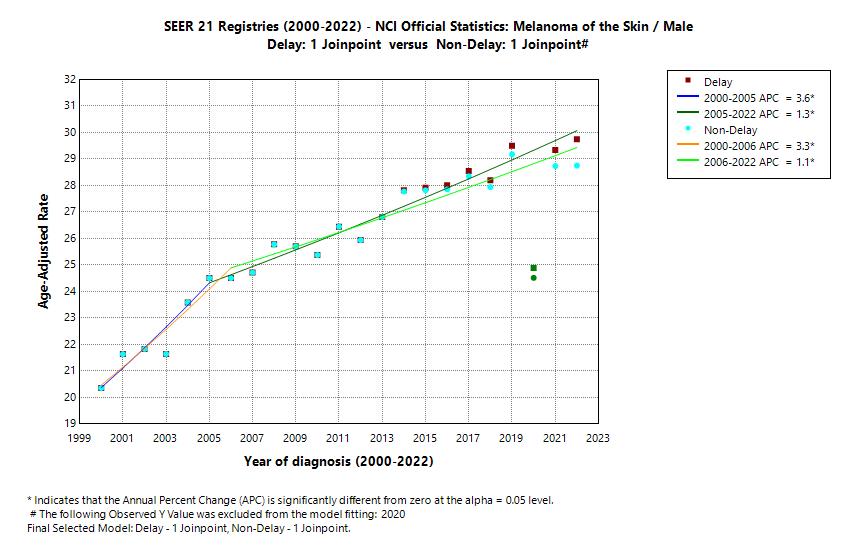
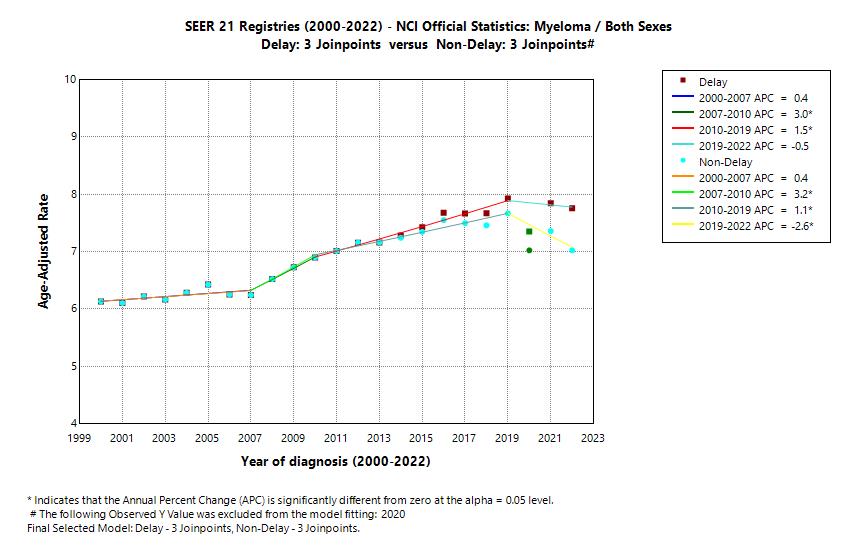
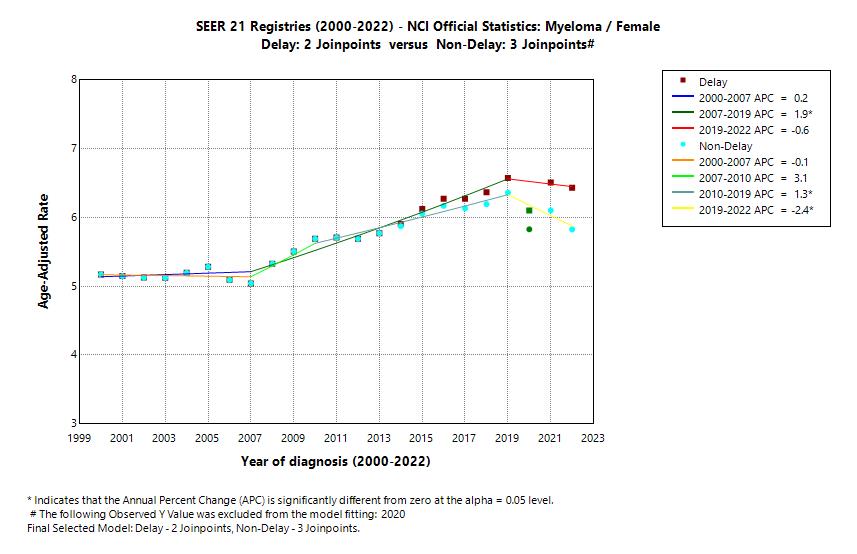
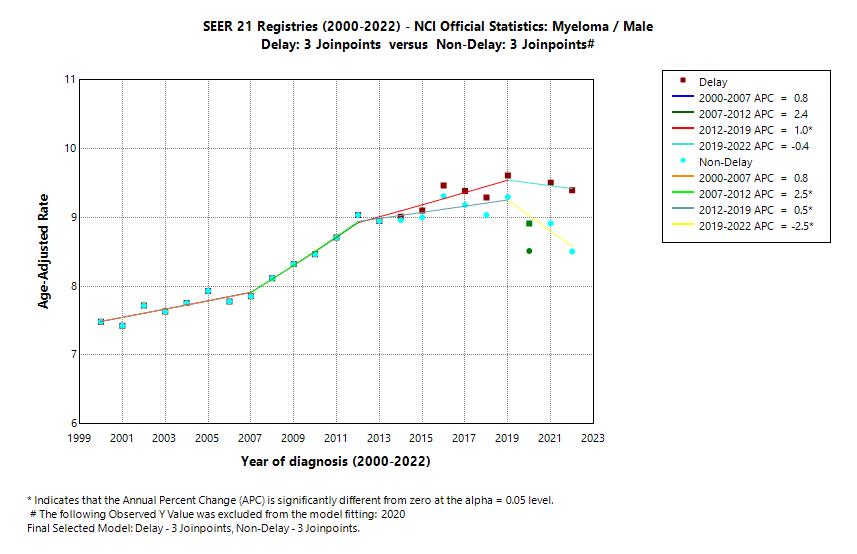
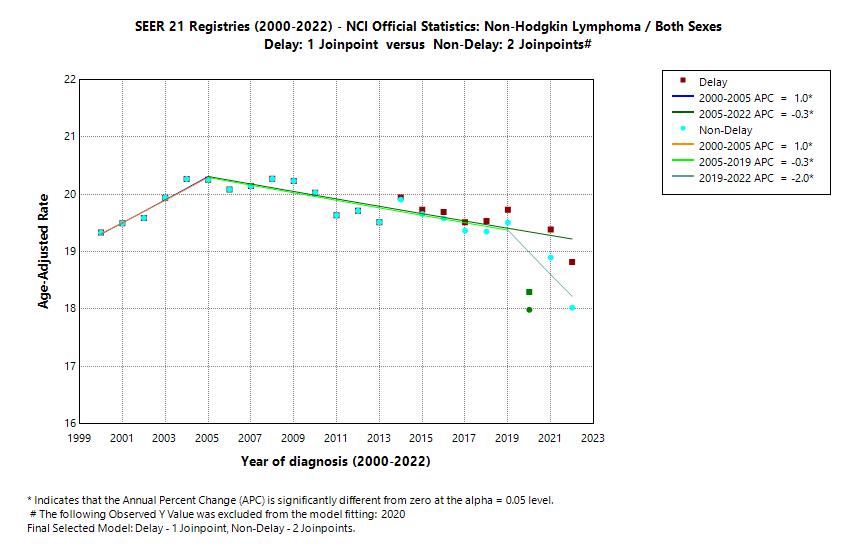
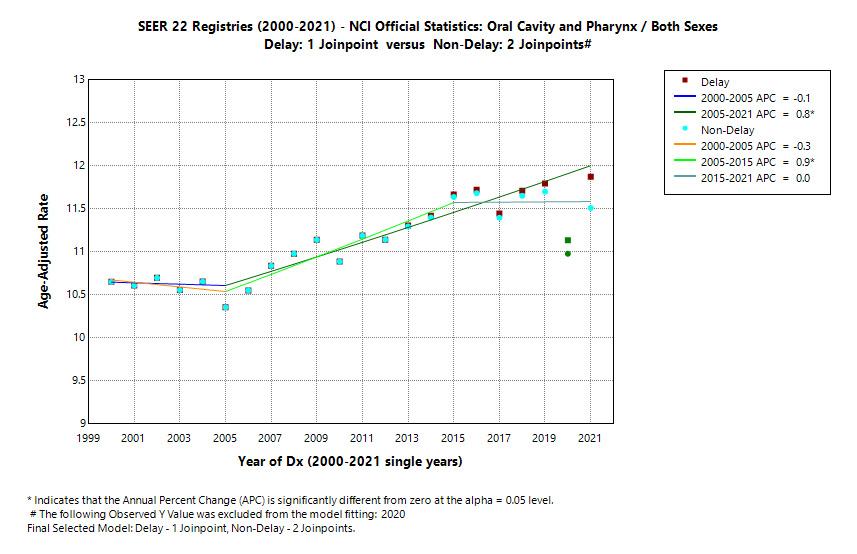
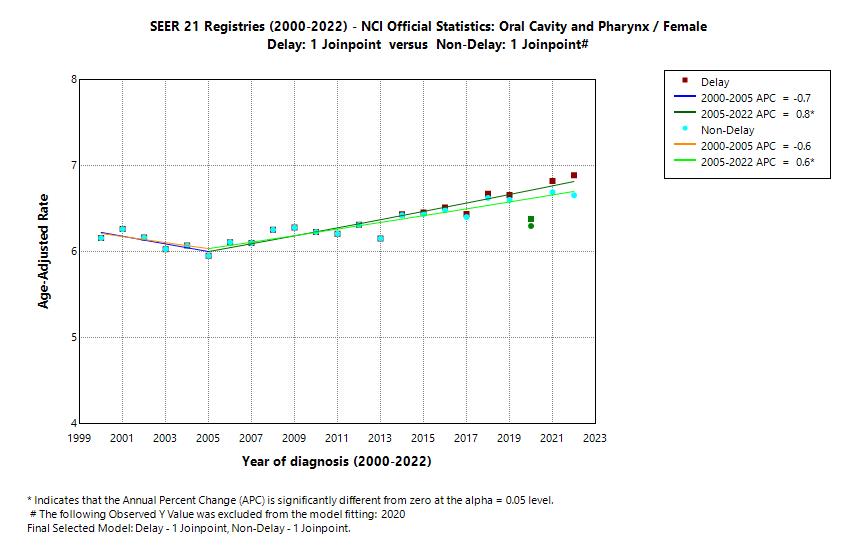
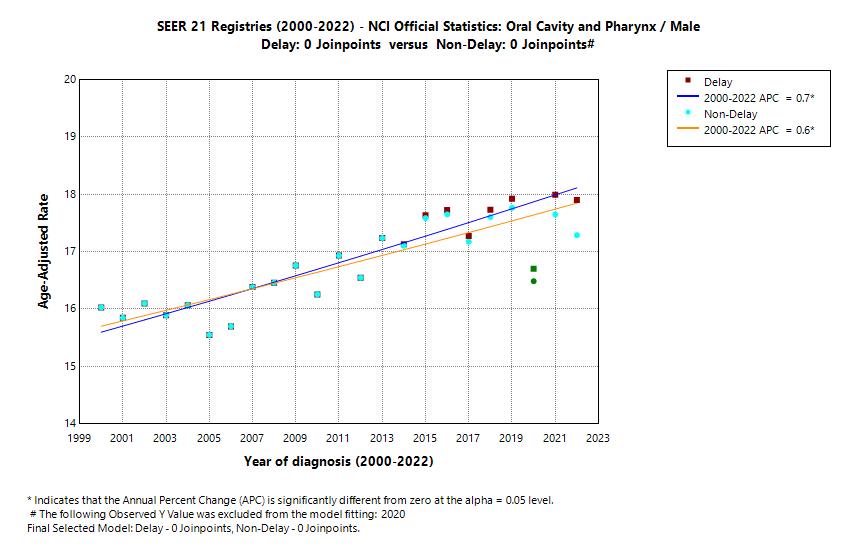
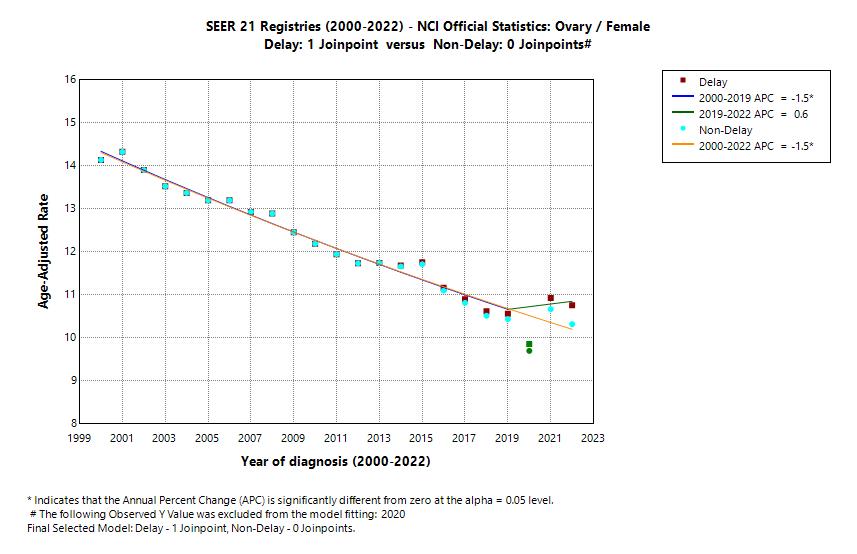
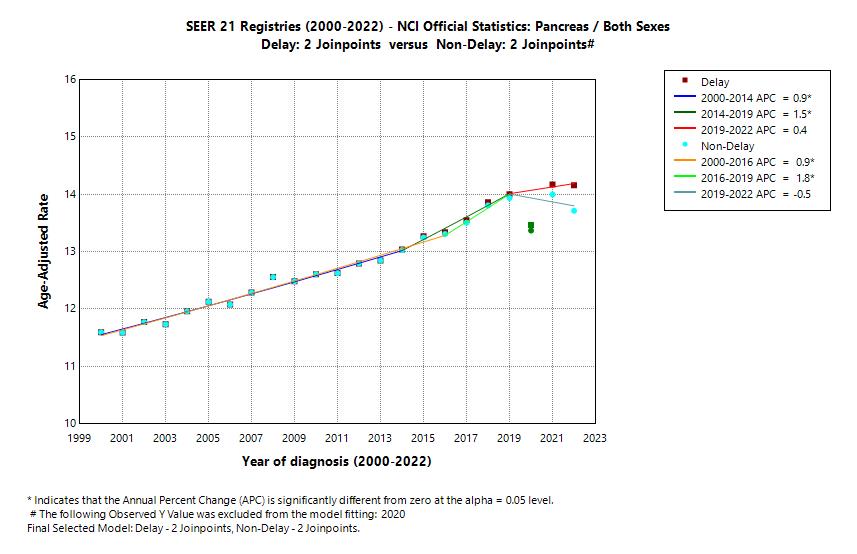
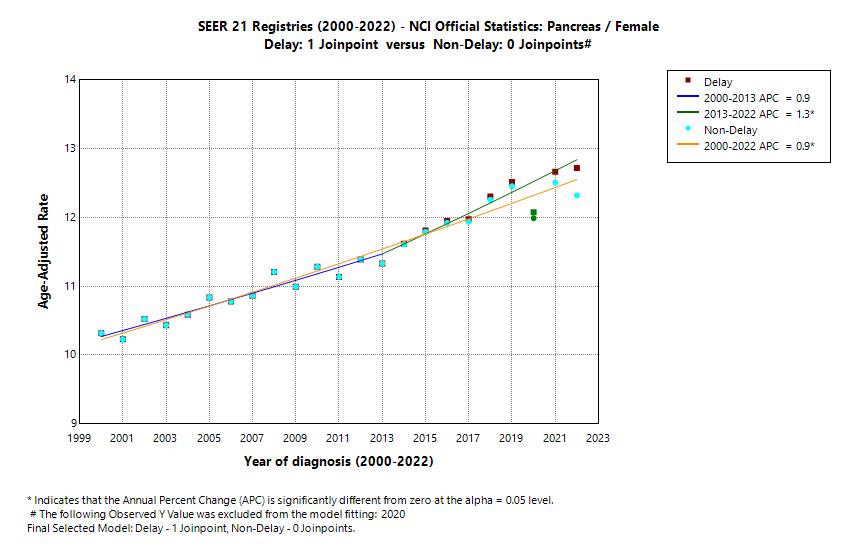
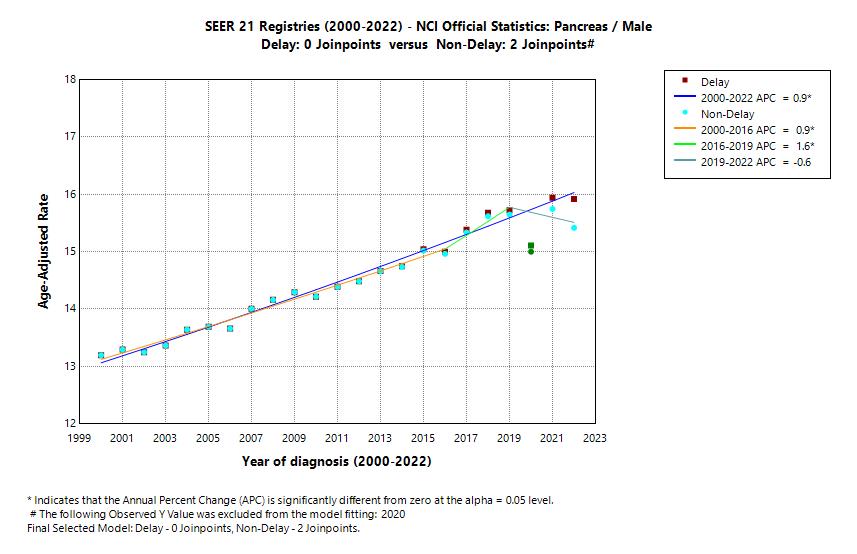
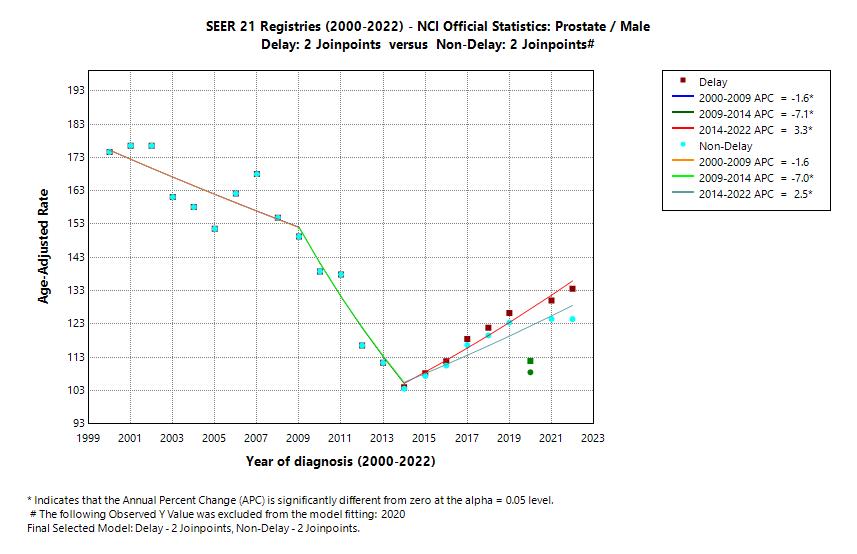
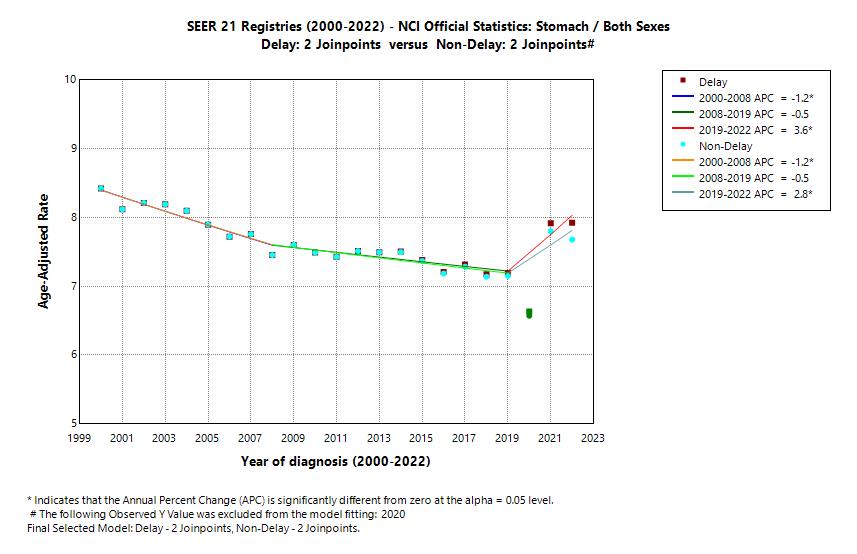
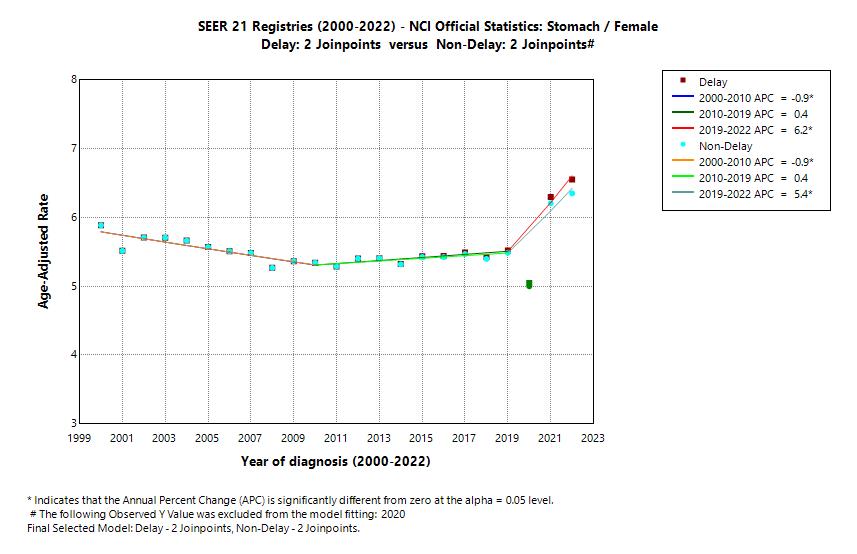
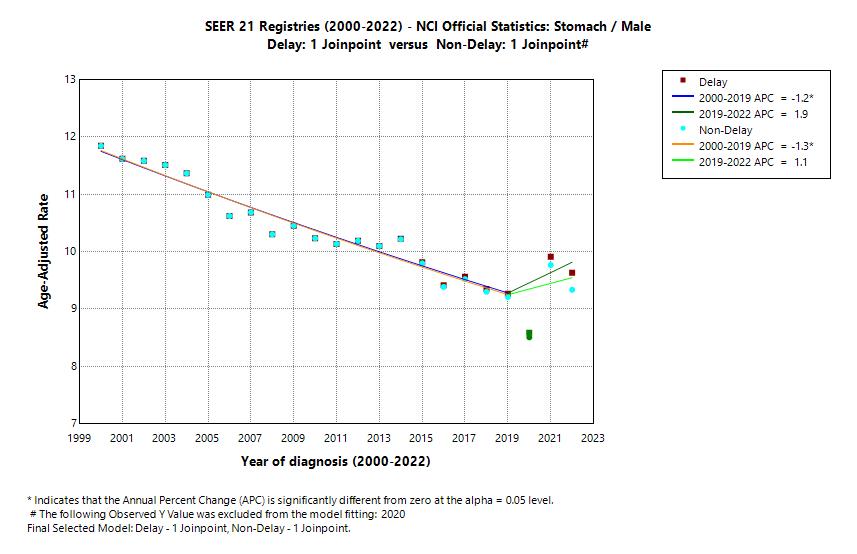
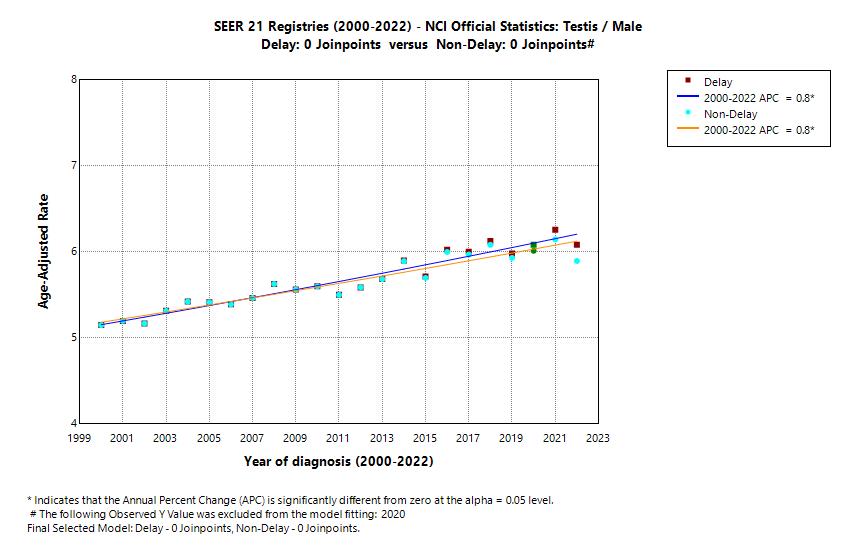
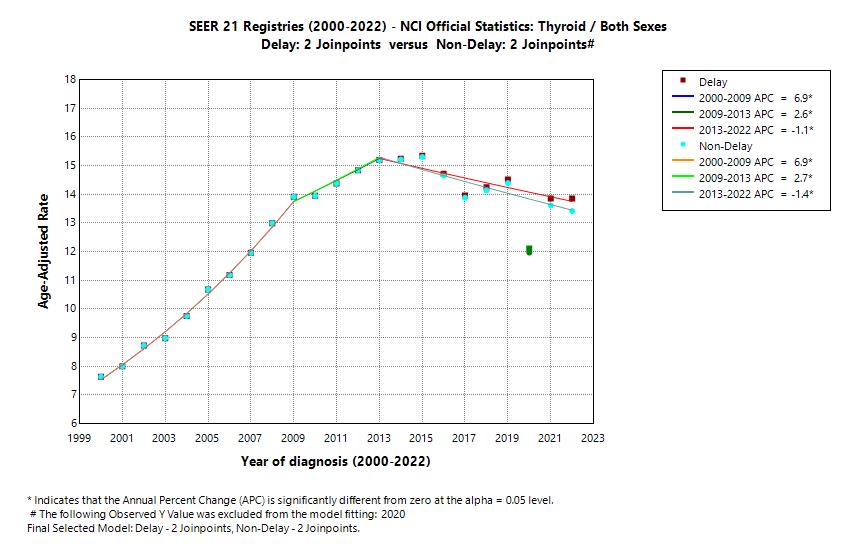
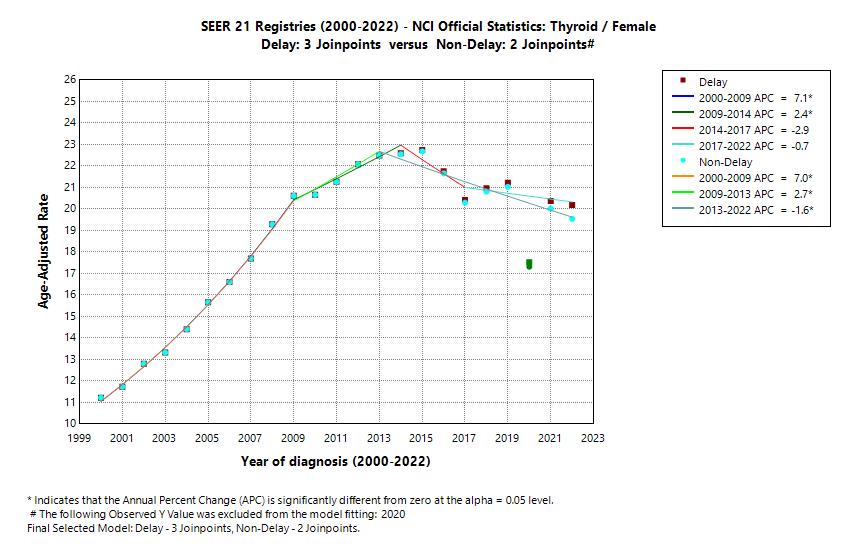
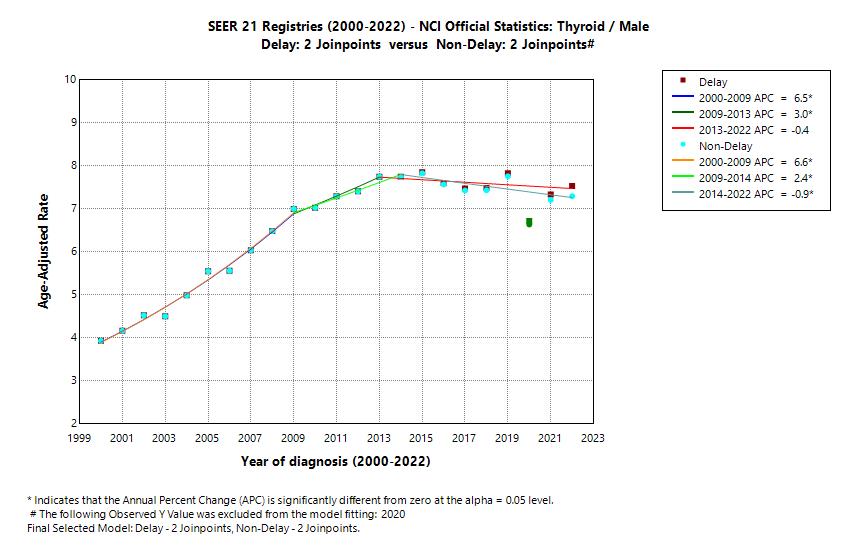
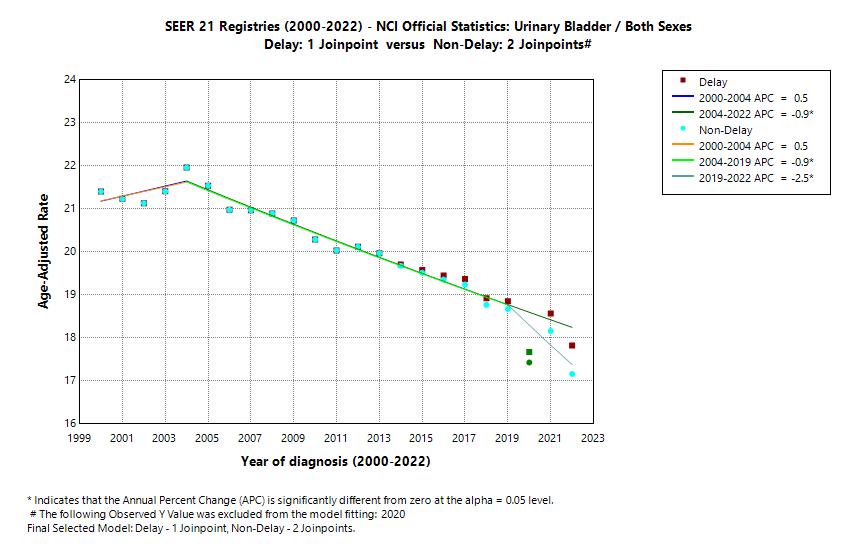
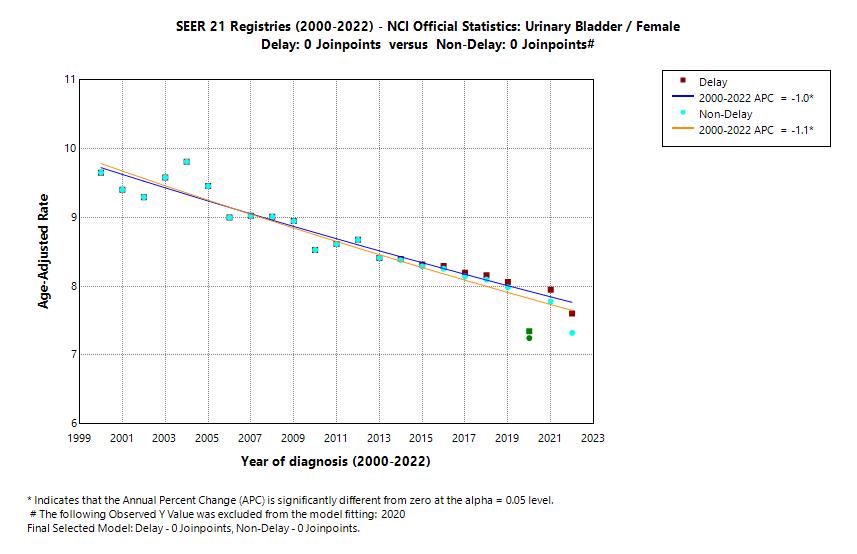
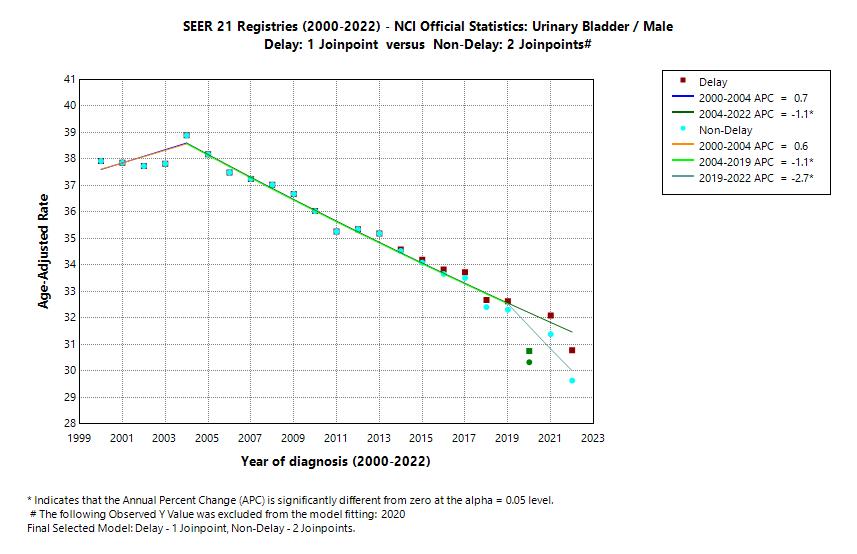
- Graph 3: SEER 21 Registries (2000-2023) - NCI Official Statistics
Estimates based on the November 2025 submission and released in April 2026. This series includes the full set of SEER 21 registries covering approximately 46% of the U.S. population.
By comparing the direction and statistical significance of the final Joinpoint segment for trends based on delay-adjusted rates between Graph1 and Graph 2, users can identify cancer site and sex combinations where the inclusion of the new 2024 incidence data suggests a change in the trend for this cancer for the selected registries. Of the 60 cancer site and sex combinations, there were 7 instances where a new trend was suggested. Caution is advised, as these trends may not be confirmed when the official November 2026 data are released in April 2027.
-
-
Brain and Other Nervous System
Both sexes
-
-
-
Colon and Rectum (including Appendix)
Both sexes
-
-
-
-
Kidney and Renal Pelvis
Both sexes
-
-
-
Liver and Intrahepatic Bile Duct
Both sexes
-
-
-
-
-
Oral Cavity and Pharynx
Both sexes
-
-
-
-
-
-
-
.BothSexes.jpg)
.BothSexes.jpg)
.BothSexes.jpg)
.Female.jpg)
.Female.jpg)
.Female.jpg)
.Male.jpg)
.Male.jpg)
.Male.jpg)

[Download Graph Data (XLSX, 349 KB)]
