

Statistics at a Glance
At a Glance
| Year | Rate of New Cases — SEER 8 | Rate of New Cases — SEER 12 | Death Rate — U.S. | 5-Year Relative Survival — SEER 8 | ||||
|---|---|---|---|---|---|---|---|---|
| Observed | Modeled Trend | Observed | Modeled Trend | Observed | Modeled Trend | Observed | Modeled Trend | |
| 1975 | 3.13 | 3.47 | - | - | 2.03 | 2.09 | 36.58% | 48.36% |
| 1976 | 3.60 | 3.49 | - | - | 2.07 | 2.01 | 40.93% | 49.89% |
| 1977 | 3.45 | 3.51 | - | - | 1.95 | 1.93 | 59.66% | 51.39% |
| 1978 | 3.43 | 3.54 | - | - | 1.80 | 1.85 | 54.57% | 52.87% |
| 1979 | 3.33 | 3.56 | - | - | 1.76 | 1.78 | 49.31% | 54.33% |
| 1980 | 3.54 | 3.58 | - | - | 1.75 | 1.71 | 56.02% | 55.76% |
| 1981 | 3.58 | 3.60 | - | - | 1.62 | 1.64 | 55.82% | 57.17% |
| 1982 | 3.24 | 3.63 | - | - | 1.63 | 1.57 | 61.53% | 58.55% |
| 1983 | 3.41 | 3.65 | - | - | 1.53 | 1.51 | 58.07% | 59.91% |
| 1984 | 3.88 | 3.67 | - | - | 1.38 | 1.45 | 51.85% | 61.23% |
| 1985 | 4.12 | 3.70 | - | - | 1.39 | 1.39 | 64.31% | 62.53% |
| 1986 | 3.65 | 3.72 | - | - | 1.34 | 1.34 | 65.36% | 63.79% |
| 1987 | 3.73 | 3.74 | - | - | 1.35 | 1.30 | 67.63% | 65.03% |
| 1988 | 3.54 | 3.77 | - | - | 1.24 | 1.26 | 70.43% | 66.24% |
| 1989 | 4.45 | 3.79 | - | - | 1.21 | 1.22 | 71.18% | 67.41% |
| 1990 | 3.87 | 3.82 | - | - | 1.19 | 1.19 | 70.15% | 68.56% |
| 1991 | 3.94 | 3.84 | - | - | 1.18 | 1.16 | 73.94% | 69.67% |
| 1992 | 3.71 | 3.87 | 4.05 | 4.24 | 1.17 | 1.12 | 72.78% | 70.75% |
| 1993 | 3.71 | 3.89 | 4.08 | 4.26 | 1.12 | 1.09 | 71.34% | 71.81% |
| 1994 | 3.38 | 3.92 | 4.00 | 4.29 | 1.06 | 1.06 | 68.17% | 72.83% |
| 1995 | 4.09 | 3.94 | 4.31 | 4.31 | 1.01 | 1.03 | 75.43% | 73.82% |
| 1996 | 4.07 | 3.97 | 4.36 | 4.33 | 0.95 | 1.00 | 74.52% | 74.79% |
| 1997 | 3.95 | 3.99 | 4.23 | 4.36 | 0.95 | 0.97 | 76.25% | 75.72% |
| 1998 | 4.16 | 4.02 | 4.61 | 4.38 | 0.85 | 0.94 | 75.93% | 76.62% |
| 1999 | 4.11 | 4.04 | 4.38 | 4.41 | 0.84 | 0.92 | 75.41% | 77.50% |
| 2000 | 4.27 | 4.07 | 4.40 | 4.43 | 0.91 | 0.89 | 75.29% | 78.35% |
| 2001 | 4.03 | 4.09 | 4.33 | 4.46 | 0.90 | 0.86 | 80.29% | 79.17% |
| 2002 | 4.46 | 4.12 | 4.78 | 4.49 | 0.83 | 0.84 | 79.43% | 79.96% |
| 2003 | 3.77 | 4.15 | 4.04 | 4.51 | 0.84 | 0.82 | 84.45% | 80.73% |
| 2004 | 4.55 | 4.17 | 4.78 | 4.54 | 0.81 | 0.79 | 82.23% | 81.47% |
| 2005 | 4.64 | 4.20 | 4.83 | 4.56 | 0.78 | 0.77 | 84.22% | 82.19% |
| 2006 | 4.19 | 4.23 | 4.55 | 4.59 | 0.74 | 0.75 | 86.59% | 82.88% |
| 2007 | 4.24 | 4.25 | 4.83 | 4.62 | 0.77 | 0.73 | 85.85% | 83.54% |
| 2008 | 4.41 | 4.28 | 4.85 | 4.64 | 0.71 | 0.71 | 85.71% | 84.19% |
| 2009 | 4.31 | 4.31 | 4.86 | 4.67 | 0.67 | 0.68 | 83.28% | 84.81% |
| 2010 | 4.34 | 4.33 | 4.78 | 4.70 | 0.66 | 0.67 | 87.97% | 85.41% |
| 2011 | 4.55 | 4.36 | 4.92 | 4.72 | 0.62 | 0.65 | 88.14% | 85.99% |
| 2012 | 4.30 | 4.39 | 4.71 | 4.75 | 0.64 | 0.63 | 82.36% | 86.54% |
| 2013 | 4.35 | 4.42 | 4.65 | 4.78 | 0.61 | 0.61 | 85.25% | 87.08% |
| 2014 | 4.27 | 4.45 | 4.95 | 4.80 | 0.55 | 0.59 | 87.79% | 87.59% |
| 2015 | 4.33 | 4.47 | 4.83 | 4.83 | 0.59 | 0.58 | 86.67% | 88.09% |
| 2016 | 4.94 | 4.50 | 5.13 | 4.86 | 0.60 | 0.56 | 89.29% | 88.57% |
| 2017 | 4.92 | 4.53 | 5.15 | 4.89 | 0.55 | 0.54 | 89.14% | 89.03% |
| 2018 | 4.34 | 4.56 | 4.85 | 4.91 | 0.55 | 0.53 | 90.71% | 89.47% |
| 2019 | 4.08 | 4.59 | 4.33 | 4.94 | 0.49 | 0.51 | - | 89.90% |
| 2020 | 4.50 | 4.62 | 4.81 | 4.97 | 0.47 | 0.50 | - | 90.31% |
| 2021 | 4.46 | 4.65 | 4.85 | 5.00 | 0.48 | 0.50 | - | 90.70% |
| 2022 | 4.11 | 4.68 | 4.40 | 5.03 | 0.54 | 0.51 | - | 91.08% |
| 2023 | 4.85 | 4.71 | 5.26 | 5.06 | 0.55 | 0.52 | - | 91.44% |
| 2024 | - | - | - | - | 0.49 | 0.52 | - | - |
New cases come from SEER 12. Deaths come from U.S. Mortality.
All Races, Ages 0–19, Both Sexes. Rates are Age-Adjusted.
Modeled trend lines were calculated from the underlying rates using the Joinpoint Trend Analysis Software.
The 2020 incidence rate is displayed but not used in the fit of the trend line(s). Impact of COVID on SEER Cancer Incidence 2020 data
New cases are also referred to as incident cases in other publications. Rates of new cases are also referred to as incidence rates.
5-Year
Relative Survival
Rate of New Cases and Deaths per 100,000: The rate of new cases of childhood leukemia was 4.9 per 100,000 children per year. The death rate was 0.5 per 100,000 children per year. These rates are age-adjusted and based on 2019–2023 cases and 2020–2024 deaths.
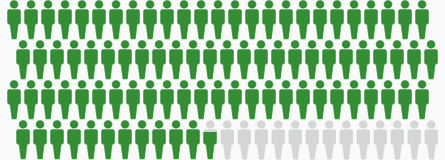
Survival Statistics
How Many People Survive 5 Years Or More after Being Diagnosed with Childhood Leukemia?
Relative survival is an estimate of the percentage of patients who would be expected to survive the effects of their cancer. It excludes the risk of dying from other causes. Because survival statistics are based on large groups of people, they cannot be used to predict exactly what will happen to an individual patient. No two patients are entirely alike, and treatment and responses to treatment can vary greatly.
5-Year
Relative Survival
Based on data from SEER 21 (Excluding IL) 2016–2022. Gray figures represent those who have died from childhood leukemia. Green figures represent those who have survived 5 years or more.
New Cases and Deaths
How Common Is This Cancer?
Compared to other childhood cancers, childhood leukemia is fairly common.
| Rank | Common Types of Childhood Cancer | New Cases Per 100,000 |
Deaths Per 100,000 |
|---|---|---|---|
| 1. | Leukemia | 4.9 | 0.5 |
| 2. | Brain and Other Nervous System Cancer | 2.7 | 0.6 |
| 3. | Non-Hodgkin Lymphoma | 1.4 | 0.1 |
| 4. | Hodgkin Lymphoma | 1.2 | 0.0 |
| 5. | Testicular Cancer | 1.2 | 0.0 |
| 6. | Soft Tissue Cancer | 1.1 | 0.2 |
| 7. | Thyroid Cancer | 1.1 | 0.0 |
| 8. | Bone and Joint Cancer | 0.9 | 0.3 |
| 9. | Ovarian Cancer | 0.8 | 0.0 |
| 10. | 0.7 | 0.2 |
Childhood leukemia represents 25.7% of all new childhood cancer cases.

25.7%
SEER 21 Incidence 2019–2023 & U.S. Mortality 2020–2024, Ages 0–19. Rates are Age-Adjusted
Who Gets This Cancer?
The rate of new cases of childhood leukemia was 4.9 per 100,000 children per year based on 2019–2023 cases, age-adjusted.
Males
| All Races | 5.5 |
|---|---|
| Hispanic | 7.3 |
| Non-Hispanic American Indian/Alaska Native | 5.3 |
| Non-Hispanic Asian/Pacific Islander | 5.1 |
| Non-Hispanic Black | 3.4 |
| Non-Hispanic White | 4.6 |
Females
| All Races | 4.2 |
|---|---|
| Hispanic | 5.3 |
| Non-Hispanic American Indian/Alaska Native | 6.6 |
| Non-Hispanic Asian/Pacific Islander | 3.5 |
| Non-Hispanic Black | 2.7 |
| Non-Hispanic White | 3.8 |


SEER 21 2019–2023, Age-Adjusted
| Age Range | Percent of New Cases |
|---|---|
| <1 | 3.6% |
| 1–4 | 34.3% |
| 5–9 | 22.4% |
| 10–14 | 20.0% |
| 15–19 | 19.7% |
Childhood leukemia is most frequently diagnosed among children aged 1–4.
Median Age
At Diagnosis
SEER 21 2019–2023, All Races, Both Sexes
Who Dies From This Cancer?
The death rate was 0.5 per 100,000 children per year based on 2020–2024 deaths, age-adjusted.
Males
| All Races | 0.6 |
|---|---|
| Hispanic | 0.9 |
| Non-Hispanic American Indian/Alaska Native | Not Shown, <16 cases |
| Non-Hispanic Asian/Pacific Islander | 0.5 |
| Non-Hispanic Black | 0.5 |
| Non-Hispanic White | 0.5 |
Females
| All Races | 0.4 |
|---|---|
| Hispanic | 0.5 |
| Non-Hispanic American Indian/Alaska Native | Not Shown, <16 cases |
| Non-Hispanic Asian/Pacific Islander | 0.3 |
| Non-Hispanic Black | 0.4 |
| Non-Hispanic White | 0.4 |
U.S. 2020–2024, Age-Adjusted
| Age Range | Percent of Deaths |
|---|---|
| <1 | 3.9% |
| 1–4 | 20.2% |
| 5–9 | 17.6% |
| 10–14 | 25.4% |
| 15–19 | 32.8% |
The percent of childhood leukemia deaths is highest among children aged 15–19.
Median Age
At Death
U.S. 2020–2024, All Races, Both Sexes
Trends in Rates
Changes Over Time
Keeping track of new cases, deaths, and survival over time (trends) can help scientists understand whether progress is being made and where additional research is needed to address challenges, such as improving screening or finding better treatments.
Using statistical models for analysis, age-adjusted rates for new childhood leukemia cases have been rising on average 0.6% each year over 2014–2023. Age-adjusted death rates have been falling on average 1.1% each year over 2015–2024. 5-year relative survival trends are shown below.
Interactive Statistics with SEER*Explorer
- Create custom graphs and tables
- Download data and images
- Share links to results
SEER*Explorer is an interactive website that provides easy access to a wide range of SEER cancer statistics. It provides detailed statistics for a cancer site by sex, race, calendar year, age, and for a selected number of cancer sites, by stage and histology.
Explore Additional Childhood Leukemia StatisticsMore About This Cancer
Cancer and the Blood
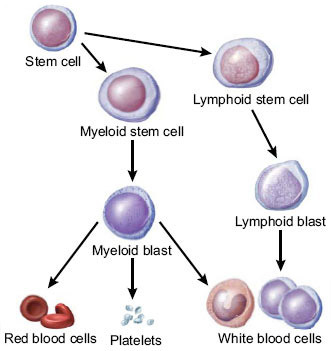
Figure: Stem cells maturing into one of three types of mature blood cells: red blood cells, platelets, and white blood cells. Precursor cells are also shown: stem cells, myeloid blasts, lymphoid stem cells, and lymphoid blasts.
Leukemia is cancer that starts in the tissue that forms blood. Most blood cells develop from cells in the bone marrow called stem cells. In a person with leukemia, the bone marrow makes abnormal white blood cells. The abnormal cells are leukemia cells. Unlike normal blood cells, leukemia cells don't die when they should. They may crowd out normal white blood cells, red blood cells, and platelets. This makes it hard for normal blood cells to do their work. The four main types of leukemia are:
- Acute lymphoblastic leukemia (ALL)
- Acute myelogenous leukemia (AML)
- Chronic lymphocytic leukemia (CLL)
- Chronic myelogenous leukemia (CML)
There is no standard staging system for leukemia. The disease is described as untreated, in remission, or recurrent.
Additional Information
More Information
Here are some resources for learning more about leukemia.
References
All statistics in this report are based on statistics from SEER and the Centers for Disease Control and Prevention's National Center for Health Statistics. Most can be found within SEER*Explorer.
Suggested Citation
All material in this report is in the public domain and may be reproduced or copied without permission; citation as to source, however, is appreciated.
SEER Cancer Stat Facts: Childhood Leukemia. National Cancer Institute. Bethesda, MD, https://seer.cancer.gov/statfacts/html/childleuk.html
These stat facts focus on population statistics that are based on the U.S. population. Because these statistics are based on large groups of people, they cannot be used to predict exactly what will happen to an individual patient. To see tailored statistics, browse SEER*Explorer. To see statistics for a specific state, go to the State Cancer Profiles.
The statistics presented in these stat facts are based on the most recent data available, most of which can be found in SEER*Explorer. In some cases, different year spans may be used.
Estimates of new cases and deaths for 2026 are projections made by the American Cancer Society (ACS), based on earlier reported data.
Cancer is a complex topic. There is a wide range of information available. These stat facts do not address causes, symptoms, diagnosis, treatment, follow-up care, or decision making, although links are provided to information in many of these areas.
