

Statistics at a Glance
At a Glance
Estimated New Cases in 2026 9,810
% of All New Cancer Cases 0.5%
Estimated Deaths in 2026 630
% of All Cancer Deaths 0.1%
5-Year
Relative Survival
| Year | Rate of New Cases — SEER 8 | Rate of New Cases — SEER 12 | Death Rate — U.S. | 5-Year Relative Survival — SEER 8 | ||||
|---|---|---|---|---|---|---|---|---|
| Observed | Modeled Trend | Observed | Modeled Trend | Observed | Modeled Trend | Observed | Modeled Trend | |
| 1975 | 3.86 | 3.77 | - | - | 0.74 | 0.78 | 79.69% | 82.28% |
| 1976 | 3.49 | 3.85 | - | - | 0.71 | 0.69 | 82.98% | 84.10% |
| 1977 | 4.44 | 3.94 | - | - | 0.65 | 0.62 | 86.12% | 85.74% |
| 1978 | 3.59 | 4.03 | - | - | 0.56 | 0.56 | 86.91% | 87.23% |
| 1979 | 4.09 | 4.12 | - | - | 0.52 | 0.50 | 90.55% | 88.57% |
| 1980 | 4.35 | 4.21 | - | - | 0.45 | 0.45 | 91.52% | 89.78% |
| 1981 | 4.36 | 4.31 | - | - | 0.37 | 0.40 | 94.17% | 90.86% |
| 1982 | 4.54 | 4.41 | - | - | 0.40 | 0.39 | 91.64% | 91.84% |
| 1983 | 4.73 | 4.51 | - | - | 0.39 | 0.38 | 90.33% | 92.72% |
| 1984 | 4.35 | 4.61 | - | - | 0.35 | 0.36 | 90.44% | 93.51% |
| 1985 | 4.43 | 4.71 | - | - | 0.36 | 0.35 | 92.26% | 94.21% |
| 1986 | 4.98 | 4.82 | - | - | 0.32 | 0.34 | 96.05% | 94.84% |
| 1987 | 5.13 | 4.93 | - | - | 0.34 | 0.33 | 96.65% | 95.40% |
| 1988 | 4.68 | 5.04 | - | - | 0.32 | 0.32 | 95.26% | 95.91% |
| 1989 | 5.50 | 5.16 | - | - | 0.32 | 0.31 | 94.85% | 95.93% |
| 1990 | 5.08 | 5.19 | - | - | 0.28 | 0.30 | 96.45% | 95.96% |
| 1991 | 5.15 | 5.23 | - | - | 0.29 | 0.29 | 96.05% | 95.99% |
| 1992 | 5.26 | 5.27 | 4.83 | 4.88 | 0.28 | 0.28 | 95.38% | 96.01% |
| 1993 | 5.18 | 5.30 | 4.84 | 4.93 | 0.30 | 0.27 | 95.19% | 96.04% |
| 1994 | 5.34 | 5.34 | 5.00 | 4.97 | 0.27 | 0.27 | 96.04% | 96.06% |
| 1995 | 4.69 | 5.38 | 4.72 | 5.02 | 0.24 | 0.26 | 96.34% | 96.09% |
| 1996 | 5.15 | 5.42 | 4.84 | 5.07 | 0.26 | 0.26 | 95.98% | 96.12% |
| 1997 | 5.49 | 5.46 | 5.09 | 5.12 | 0.24 | 0.26 | 95.07% | 96.14% |
| 1998 | 5.67 | 5.49 | 5.38 | 5.17 | 0.28 | 0.26 | 95.63% | 96.17% |
| 1999 | 5.54 | 5.53 | 5.10 | 5.22 | 0.28 | 0.26 | 95.21% | 96.19% |
| 2000 | 5.90 | 5.57 | 5.45 | 5.27 | 0.25 | 0.26 | 95.77% | 96.22% |
| 2001 | 5.45 | 5.61 | 5.36 | 5.32 | 0.24 | 0.26 | 97.06% | 96.24% |
| 2002 | 5.89 | 5.65 | 5.28 | 5.37 | 0.28 | 0.25 | 96.91% | 96.27% |
| 2003 | 5.43 | 5.69 | 5.31 | 5.43 | 0.25 | 0.25 | 97.39% | 96.29% |
| 2004 | 6.01 | 5.73 | 5.54 | 5.48 | 0.25 | 0.25 | 95.85% | 96.31% |
| 2005 | 6.06 | 5.77 | 5.81 | 5.53 | 0.25 | 0.25 | 96.93% | 96.34% |
| 2006 | 5.75 | 5.82 | 5.58 | 5.59 | 0.25 | 0.25 | 98.44% | 96.36% |
| 2007 | 6.08 | 5.86 | 6.00 | 5.64 | 0.23 | 0.25 | 95.67% | 96.39% |
| 2008 | 6.17 | 5.90 | 5.84 | 5.70 | 0.24 | 0.25 | 96.56% | 96.41% |
| 2009 | 6.18 | 5.94 | 5.92 | 5.75 | 0.25 | 0.25 | 97.16% | 96.43% |
| 2010 | 5.83 | 5.98 | 5.69 | 5.81 | 0.26 | 0.25 | 97.51% | 96.46% |
| 2011 | 6.06 | 6.02 | 5.69 | 5.86 | 0.25 | 0.25 | 96.86% | 96.48% |
| 2012 | 6.02 | 6.07 | 5.87 | 5.92 | 0.25 | 0.25 | 97.98% | 96.50% |
| 2013 | 6.09 | 6.11 | 5.98 | 5.98 | 0.24 | 0.25 | 96.04% | 96.53% |
| 2014 | 6.53 | 6.15 | 6.40 | 6.04 | 0.26 | 0.25 | 96.92% | 96.55% |
| 2015 | 5.77 | 6.20 | 5.86 | 6.10 | 0.23 | 0.25 | 96.72% | 96.57% |
| 2016 | 6.44 | 6.24 | 6.26 | 6.16 | 0.27 | 0.25 | 96.62% | 96.60% |
| 2017 | 6.37 | 6.29 | 6.31 | 6.22 | 0.26 | 0.26 | 94.98% | 96.62% |
| 2018 | 6.11 | 6.33 | 6.21 | 6.28 | 0.25 | 0.27 | 97.21% | 96.64% |
| 2019 | 6.02 | 6.38 | 6.08 | 6.34 | 0.28 | 0.27 | - | 96.66% |
| 2020 | 6.38 | 6.42 | 6.40 | 6.40 | 0.28 | 0.28 | - | 96.68% |
| 2021 | 6.62 | 6.47 | 6.69 | 6.46 | 0.29 | 0.28 | - | 96.71% |
| 2022 | 6.22 | 6.51 | 6.12 | 6.52 | 0.30 | 0.29 | - | 96.73% |
| 2023 | 6.59 | 6.56 | 6.57 | 6.59 | 0.32 | 0.30 | - | 96.75% |
| 2024 | - | - | - | - | 0.27 | 0.30 | - | - |
New cases come from SEER 12. Deaths come from U.S. Mortality.
All Races, Males. Rates are Age-Adjusted.
Modeled trend lines were calculated from the underlying rates using the Joinpoint Trend Analysis Software.
The 2020 incidence rate is displayed but not used in the fit of the trend line(s). Impact of COVID on SEER Cancer Incidence 2020 data
New cases are also referred to as incident cases in other publications. Rates of new cases are also referred to as incidence rates.
Rate of New Cases and Deaths per 100,000: The rate of new cases of testicular cancer was 6.1 per 100,000 men per year. The death rate was 0.3 per 100,000 men per year. These rates are age-adjusted and based on 2019–2023 cases and 2020–2024 deaths.
Lifetime Risk of Developing Cancer: Approximately 0.4 percent of men will be diagnosed with testicular cancer at some point during their lifetime, based on 2021–2023 data.
Prevalence of This Cancer: In 2023, there were an estimated 325,990 men living with testicular cancer in the United States.
Survival Statistics
How Many People Survive 5 Years Or More after Being Diagnosed with Testicular Cancer?
Relative survival is an estimate of the percentage of patients who would be expected to survive the effects of their cancer. It excludes the risk of dying from other causes. Because survival statistics are based on large groups of people, they cannot be used to predict exactly what will happen to an individual patient. No two patients are entirely alike, and treatment and responses to treatment can vary greatly.

5-Year
Relative Survival
Based on data from SEER 21 (Excluding IL) 2016–2022. Gray figures represent those who have died from testicular cancer. Green figures represent those who have survived 5 years or more.
New Cases and Deaths
How Common Is This Cancer?
Compared to other cancers, testicular cancer is rare.
| Rank | Common Types of Cancer | Estimated New Cases 2026 |
Estimated Deaths 2026 |
|---|---|---|---|
| 1. | Prostate Cancer | 333,830 | 36,320 |
| 2. | Breast Cancer (Female) | 321,910 | 42,140 |
| 3. | Lung and Bronchus Cancer | 229,410 | 124,990 |
| 4. | Colorectal Cancer | 158,850 | 55,230 |
| 5. | Melanoma of the Skin | 112,000 | 8,510 |
| 6. | Bladder Cancer | 84,530 | 17,870 |
| 7. | Kidney and Renal Pelvis Cancer | 80,450 | 15,160 |
| 8. | Non-Hodgkin Lymphoma | 79,320 | 19,970 |
| 9. | Uterine Cancer | 68,270 | 14,450 |
| 10. | Leukemia | 67,790 | 23,910 |
| - | - | - | |
| 25. | Testicular Cancer | 9,810 | 630 |
Testicular cancer represents 0.5% of all new cancer cases in the U.S.

0.5%
In 2026, it is estimated that there will be 9,810 new cases of testicular cancer and an estimated 630 people will die of this disease.
Who Gets This Cancer?
Testicular cancer is most common in young adults. The rate of new cases of testicular cancer was 6.1 per 100,000 men per year based on 2019–2023 cases, age-adjusted.
Males
| All Races | 6.1 |
|---|---|
| Hispanic | 6.8 |
| Non-Hispanic American Indian/Alaska Native | 7.2 |
| Non-Hispanic Asian/Pacific Islander | 2.6 |
| Non-Hispanic Black | 1.6 |
| Non-Hispanic White | 7.2 |
Females
| All Races | Sex-specific cancer type |
|---|---|
| Hispanic | |
| Non-Hispanic American Indian/Alaska Native | |
| Non-Hispanic Asian/Pacific Islander | |
| Non-Hispanic Black | |
| Non-Hispanic White |


SEER 21 2019–2023, Age-Adjusted
| Age Range | Percent of New Cases |
|---|---|
| <20 | 5.2% |
| 20–34 | 51.0% |
| 35–44 | 25.1% |
| 45–54 | 10.4% |
| 55–64 | 5.2% |
| 65–74 | 2.3% |
| 75–84 | 0.7% |
| >84 | 0.2% |
Testicular cancer is most frequently diagnosed among men aged 20–34.
Median Age
At Diagnosis
SEER 21 2019–2023, All Races, Males
Who Dies From This Cancer?
The death rate was 0.3 per 100,000 men per year based on 2020–2024, age-adjusted.
Males
| All Races | 0.3 |
|---|---|
| Hispanic | 0.4 |
| Non-Hispanic American Indian/Alaska Native | 0.6 |
| Non-Hispanic Asian/Pacific Islander | 0.1 |
| Non-Hispanic Black | 0.1 |
| Non-Hispanic White | 0.3 |
Females
| All Races | Sex-specific cancer type |
|---|---|
| Hispanic | |
| Non-Hispanic American Indian/Alaska Native | |
| Non-Hispanic Asian/Pacific Islander | |
| Non-Hispanic Black | |
| Non-Hispanic White |
U.S. 2020–2024, Age-Adjusted
| Age Range | Percent of Deaths |
|---|---|
| <20 | 1.7% |
| 20–34 | 34.2% |
| 35–44 | 21.7% |
| 45–54 | 12.8% |
| 55–64 | 12.2% |
| 65–74 | 9.4% |
| 75–84 | 4.7% |
| >84 | 3.3% |
The percent of testicular cancer deaths is highest among men aged 20–34.
Median Age
At Death
U.S. 2020–2024, All Races, Males
Trends in Rates
Changes Over Time
Keeping track of new cases, deaths, and survival over time (trends) can help scientists understand whether progress is being made and where additional research is needed to address challenges, such as improving screening or finding better treatments.
Using statistical models for analysis, age-adjusted rates for new testicular cancer cases have been rising on average 0.7% each year over 2014–2023. Age-adjusted death rates have been rising on average 2.3% each year over 2015–2024. 5-year relative survival trends are shown below.
Interactive Statistics with SEER*Explorer
- Create custom graphs and tables
- Download data and images
- Share links to results
SEER*Explorer is an interactive website that provides easy access to a wide range of SEER cancer statistics. It provides detailed statistics for a cancer site by sex, race, calendar year, age, and for a selected number of cancer sites, by stage and histology.
Explore Additional Testicular Cancer StatisticsMore About This Cancer
Cancer and the Testis
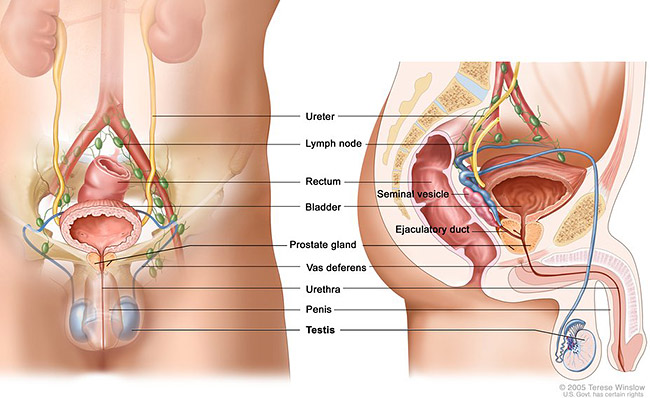
Figure: Anatomy of the male reproductive and urinary systems; drawing shows front and side views of ureters, lymph nodes, rectum, bladder, prostate gland, vas deferens, urethra, penis, testicles, seminal vesicle, and ejaculatory duct.
Testicularcancer forms in tissues of one or both testicles. Most testicular cancers begin in germ cells (cells that make sperm) and are called testicular germ cell tumors.
Additional Information
More Information
Here are some resources for learning more about testicular cancer.
- More about risk factors, symptoms, diagnosis, and treatment options for testicular cancer
- More about clinical trials
- More about cancer prevention
References
All statistics in this report are based on statistics from SEER and the Centers for Disease Control and Prevention's National Center for Health Statistics. Most can be found within SEER*Explorer.
Suggested Citation
All material in this report is in the public domain and may be reproduced or copied without permission; citation as to source, however, is appreciated.
SEER Cancer Stat Facts: Testicular Cancer. National Cancer Institute. Bethesda, MD, https://seer.cancer.gov/statfacts/html/testis.html
These stat facts focus on population statistics that are based on the U.S. population. Because these statistics are based on large groups of people, they cannot be used to predict exactly what will happen to an individual patient. To see tailored statistics, browse SEER*Explorer. To see statistics for a specific state, go to the State Cancer Profiles.
The statistics presented in these stat facts are based on the most recent data available, most of which can be found in SEER*Explorer. In some cases, different year spans may be used.
Estimates of new cases and deaths for 2026 are projections made by the American Cancer Society (ACS), based on earlier reported data.
Cancer is a complex topic. There is a wide range of information available. These stat facts do not address causes, symptoms, diagnosis, treatment, follow-up care, or decision making, although links are provided to information in many of these areas.
