

Statistics at a Glance
At a Glance
Estimated New Cases in 2026 20,420
% of All New Cancer Cases 1.0%
Estimated Deaths in 2026 3,560
% of All Cancer Deaths 0.6%
5-Year
Relative Survival
| Year | Rate of New Cases — SEER 8 | Rate of New Cases — SEER 12 | Death Rate — U.S. | 5-Year Relative Survival — SEER 8 | ||||
|---|---|---|---|---|---|---|---|---|
| Observed | Modeled Trend | Observed | Modeled Trend | Observed | Modeled Trend | Observed | Modeled Trend | |
| 1975 | 2.21 | 2.29 | - | - | 1.01 | 1.03 | 40.63% | 38.01% |
| 1976 | 2.24 | 2.30 | - | - | 1.00 | 1.01 | 39.42% | 39.01% |
| 1977 | 2.04 | 2.31 | - | - | 0.94 | 0.99 | 37.86% | 40.01% |
| 1978 | 2.17 | 2.32 | - | - | 0.97 | 0.97 | 43.33% | 41.00% |
| 1979 | 2.53 | 2.33 | - | - | 0.98 | 0.95 | 45.30% | 41.99% |
| 1980 | 2.32 | 2.34 | - | - | 0.91 | 0.94 | 43.49% | 42.98% |
| 1981 | 2.41 | 2.35 | - | - | 0.91 | 0.92 | 49.31% | 43.97% |
| 1982 | 2.23 | 2.36 | - | - | 0.92 | 0.90 | 38.51% | 44.95% |
| 1983 | 2.63 | 2.37 | - | - | 0.89 | 0.88 | 45.28% | 45.92% |
| 1984 | 2.51 | 2.38 | - | - | 0.90 | 0.87 | 51.03% | 46.89% |
| 1985 | 2.64 | 2.39 | - | - | 0.85 | 0.85 | 50.21% | 47.85% |
| 1986 | 2.33 | 2.40 | - | - | 0.85 | 0.84 | 52.84% | 48.80% |
| 1987 | 2.59 | 2.41 | - | - | 0.80 | 0.82 | 47.43% | 49.75% |
| 1988 | 2.22 | 2.42 | - | - | 0.82 | 0.81 | 46.01% | 50.69% |
| 1989 | 2.53 | 2.44 | - | - | 0.82 | 0.79 | 48.03% | 51.62% |
| 1990 | 2.48 | 2.45 | - | - | 0.80 | 0.78 | 53.28% | 52.55% |
| 1991 | 2.16 | 2.46 | - | - | 0.78 | 0.76 | 52.96% | 53.46% |
| 1992 | 2.47 | 2.47 | 2.44 | 2.48 | 0.74 | 0.75 | 45.01% | 54.37% |
| 1993 | 2.61 | 2.48 | 2.53 | 2.48 | 0.74 | 0.73 | 54.14% | 55.26% |
| 1994 | 2.49 | 2.49 | 2.51 | 2.49 | 0.70 | 0.72 | 55.96% | 56.15% |
| 1995 | 2.37 | 2.50 | 2.43 | 2.50 | 0.71 | 0.71 | 54.40% | 57.02% |
| 1996 | 2.49 | 2.51 | 2.56 | 2.50 | 0.67 | 0.69 | 55.52% | 57.89% |
| 1997 | 2.52 | 2.52 | 2.46 | 2.51 | 0.69 | 0.68 | 60.82% | 58.74% |
| 1998 | 2.52 | 2.54 | 2.55 | 2.52 | 0.66 | 0.67 | 55.56% | 59.59% |
| 1999 | 2.44 | 2.55 | 2.48 | 2.52 | 0.63 | 0.66 | 55.46% | 60.42% |
| 2000 | 2.48 | 2.61 | 2.50 | 2.58 | 0.63 | 0.64 | 63.32% | 61.24% |
| 2001 | 2.59 | 2.67 | 2.59 | 2.63 | 0.64 | 0.64 | 60.06% | 62.05% |
| 2002 | 3.00 | 2.74 | 2.87 | 2.68 | 0.65 | 0.64 | 59.55% | 62.85% |
| 2003 | 2.84 | 2.81 | 2.68 | 2.74 | 0.64 | 0.63 | 63.13% | 63.64% |
| 2004 | 3.08 | 2.88 | 2.92 | 2.79 | 0.63 | 0.63 | 67.50% | 64.41% |
| 2005 | 2.81 | 2.95 | 2.76 | 2.85 | 0.64 | 0.63 | 62.44% | 65.18% |
| 2006 | 3.07 | 3.02 | 2.89 | 2.91 | 0.61 | 0.62 | 66.61% | 65.93% |
| 2007 | 3.16 | 3.09 | 2.99 | 2.97 | 0.63 | 0.62 | 68.55% | 66.67% |
| 2008 | 3.21 | 3.17 | 3.10 | 3.03 | 0.61 | 0.62 | 68.81% | 67.40% |
| 2009 | 3.26 | 3.25 | 3.16 | 3.09 | 0.59 | 0.61 | 70.69% | 68.11% |
| 2010 | 3.19 | 3.33 | 3.04 | 3.16 | 0.62 | 0.61 | 69.00% | 68.82% |
| 2011 | 3.42 | 3.41 | 3.23 | 3.22 | 0.59 | 0.61 | 73.08% | 69.51% |
| 2012 | 3.38 | 3.49 | 3.25 | 3.29 | 0.63 | 0.62 | 72.52% | 70.19% |
| 2013 | 3.38 | 3.58 | 3.25 | 3.36 | 0.60 | 0.63 | 68.80% | 70.86% |
| 2014 | 3.67 | 3.67 | 3.43 | 3.43 | 0.64 | 0.63 | 71.25% | 71.52% |
| 2015 | 3.91 | 3.76 | 3.60 | 3.50 | 0.65 | 0.64 | 73.02% | 72.17% |
| 2016 | 3.87 | 3.85 | 3.48 | 3.51 | 0.70 | 0.65 | 72.46% | 72.80% |
| 2017 | 3.79 | 3.87 | 3.49 | 3.53 | 0.68 | 0.66 | 74.97% | 73.42% |
| 2018 | 4.17 | 3.89 | 3.69 | 3.55 | 0.65 | 0.67 | 73.77% | 74.03% |
| 2019 | 3.70 | 3.92 | 3.44 | 3.56 | 0.66 | 0.68 | - | 74.63% |
| 2020 | 3.52 | 3.94 | 3.30 | 3.58 | 0.69 | 0.69 | - | 75.22% |
| 2021 | 3.99 | 3.96 | 3.65 | 3.60 | 0.72 | 0.71 | - | 75.80% |
| 2022 | 4.03 | 3.98 | 3.67 | 3.61 | 0.71 | 0.72 | - | 76.36% |
| 2023 | 3.97 | 4.00 | 3.56 | 3.63 | 0.72 | 0.73 | - | 76.91% |
| 2024 | - | - | - | - | 0.75 | 0.74 | - | - |
New cases come from SEER 12. Deaths come from U.S. Mortality.
All Races, Both Sexes. Rates are Age-Adjusted.
Modeled trend lines were calculated from the underlying rates using the Joinpoint Trend Analysis Software.
The 2020 incidence rate is displayed but not used in the fit of the trend line(s). Impact of COVID on SEER Cancer Incidence 2020 data
New cases are also referred to as incident cases in other publications. Rates of new cases are also referred to as incidence rates.
Rate of New Cases and Deaths per 100,000: The rate of new cases of tongue cancer was 3.7 per 100,000 men and women per year. The death rate was 0.7 per 100,000 men and women per year. These rates are age-adjusted and based on 2019–2023 cases and 2020–2024 deaths.
Lifetime Risk of Developing Cancer: Approximately 0.4 percent of men and women will be diagnosed with tongue cancer at some point during their lifetime, based on 2021–2023 data.
Survival Statistics
How Many People Survive 5 Years Or More after Being Diagnosed with Tongue Cancer?
Relative survival is an estimate of the percentage of patients who would be expected to survive the effects of their cancer. It excludes the risk of dying from other causes. Because survival statistics are based on large groups of people, they cannot be used to predict exactly what will happen to an individual patient. No two patients are entirely alike, and treatment and responses to treatment can vary greatly.
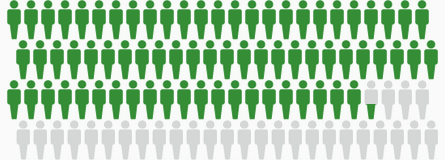
5-Year
Relative Survival
Based on data from SEER 21 (Excluding IL) 2016–2022. Gray figures represent those who have died from tongue cancer. Green figures represent those who have survived 5 years or more.
Survival by Stage
Cancer stage at diagnosis, which refers to extent of a cancer in the body, determines treatment options and has a strong influence on the length of survival. In general, if the cancer is found only in the part of the body where it started it is localized (sometimes referred to as stage 1). If it has spread to a different part of the body, the stage is regional or distant. The earlier tongue cancer is caught, the better chance a person has of surviving five years after being diagnosed. For tongue cancer, 28.3% are diagnosed at the local stage. The 5-year relative survival for localized tongue cancer is 88.2%.
| Stage | Percent of Cases | 5-Year Relative Survival |
|---|---|---|
| Localized Confined to Primary Site |
28% | 88.2% |
| Regional Spread to Regional Lymph Nodes |
58% | 69.9% |
| Distant Cancer Has Metastasized |
10% | 38.4% |
| Unknown Unstaged |
4% | 57.7% |
SEER 21 (Excluding IL) 2016–2022, All Races, Both Sexes by SEER Combined Summary Stage
New Cases and Deaths
How Common Is This Cancer?
Compared to other cancers, tongue cancer is relatively rare.
| Rank | Common Types of Cancer | Estimated New Cases 2026 |
Estimated Deaths 2026 |
|---|---|---|---|
| 1. | Prostate Cancer | 333,830 | 36,320 |
| 2. | Breast Cancer (Female) | 321,910 | 42,140 |
| 3. | Lung and Bronchus Cancer | 229,410 | 124,990 |
| 4. | Colorectal Cancer | 158,850 | 55,230 |
| 5. | Melanoma of the Skin | 112,000 | 8,510 |
| 6. | Bladder Cancer | 84,530 | 17,870 |
| 7. | Kidney and Renal Pelvis Cancer | 80,450 | 15,160 |
| 8. | Non-Hodgkin Lymphoma | 79,320 | 19,970 |
| 9. | Uterine Cancer | 68,270 | 14,450 |
| 10. | Leukemia | 67,790 | 23,910 |
| - | - | - | |
| 19. | Tongue Cancer | 20,420 | 3,560 |
Tongue cancer represents 1.0% of all new cancer cases in the U.S.

1.0%
In 2026, it is estimated that there will be 20,420 new cases of tongue cancer and an estimated 3,560 people will die of this disease.
Who Gets This Cancer?
Tongue cancer is more common in men than women. Tobacco use, heavy alcohol use, and infection with human papillomavirus (HPV), especially HPV 16, are associated with this cancer. The rate of new cases of tongue cancer was 3.7 per 100,000 men and women per year based on 2019–2023 cases, age-adjusted.
Males
| All Races | 5.5 |
|---|---|
| Hispanic | 2.9 |
| Non-Hispanic American Indian/Alaska Native | 5.2 |
| Non-Hispanic Asian/Pacific Islander | 3.1 |
| Non-Hispanic Black | 3.0 |
| Non-Hispanic White | 7.0 |
Females
| All Races | 2.1 |
|---|---|
| Hispanic | 1.5 |
| Non-Hispanic American Indian/Alaska Native | 2.1 |
| Non-Hispanic Asian/Pacific Islander | 1.8 |
| Non-Hispanic Black | 1.0 |
| Non-Hispanic White | 2.5 |


SEER 21 2019–2023, Age-Adjusted
| Age Range | Percent of New Cases |
|---|---|
| <20 | 0.1% |
| 20–34 | 1.6% |
| 35–44 | 3.5% |
| 45–54 | 12.0% |
| 55–64 | 29.5% |
| 65–74 | 32.6% |
| 75–84 | 16.2% |
| >84 | 4.6% |
Tongue cancer is most frequently diagnosed among people aged 65–74.
Median Age
At Diagnosis
SEER 21 2019–2023, All Races, Both Sexes
Who Dies From This Cancer?
For tongue cancer, death rates increase with age. Men are more likely than women to die of this cancer. The death rate was 0.7 per 100,000 men and women per year based on 2020–2024 deaths, age-adjusted.
Males
| All Races | 1.1 |
|---|---|
| Hispanic | 0.6 |
| Non-Hispanic American Indian/Alaska Native | 0.7 |
| Non-Hispanic Asian/Pacific Islander | 0.6 |
| Non-Hispanic Black | 0.7 |
| Non-Hispanic White | 1.2 |
Females
| All Races | 0.4 |
|---|---|
| Hispanic | 0.3 |
| Non-Hispanic American Indian/Alaska Native | 0.6 |
| Non-Hispanic Asian/Pacific Islander | 0.3 |
| Non-Hispanic Black | 0.2 |
| Non-Hispanic White | 0.5 |
U.S. 2020–2024, Age-Adjusted
| Age Range | Percent of Deaths |
|---|---|
| <20 | 0.0% |
| 20–34 | 0.8% |
| 35–44 | 2.0% |
| 45–54 | 7.3% |
| 55–64 | 22.5% |
| 65–74 | 31.3% |
| 75–84 | 24.4% |
| >84 | 11.6% |
The percent of tongue cancer deaths is highest among people aged 65–74.
Median Age
At Death
U.S. 2020–2024, All Races, Both Sexes
Trends in Rates
Changes Over Time
Keeping track of new cases, deaths, and survival over time (trends) can help scientists understand whether progress is being made and where additional research is needed to address challenges, such as improving screening or finding better treatments.
Using statistical models for analysis, age-adjusted rates for new tongue cancer cases have been rising on average 1.0% each year over 2014–2023. Age-adjusted death rates have been rising on average 1.5% each year over 2015–2024. 5-year relative survival trends are shown below.
Interactive Statistics with SEER*Explorer
- Create custom graphs and tables
- Download data and images
- Share links to results
SEER*Explorer is an interactive website that provides easy access to a wide range of SEER cancer statistics. It provides detailed statistics for a cancer site by sex, race, calendar year, age, and for a selected number of cancer sites, by stage and histology.
Explore Additional Tongue Cancer StatisticsMore About This Cancer
Cancer and the Tongue

Figure: Head and neck anatomy; shows paranasal sinuses, nasal cavity, pharynx (including nasopharynx, oropharynx, and hypopharynx), oral cavity, tongue, salivary glands, and larynx.
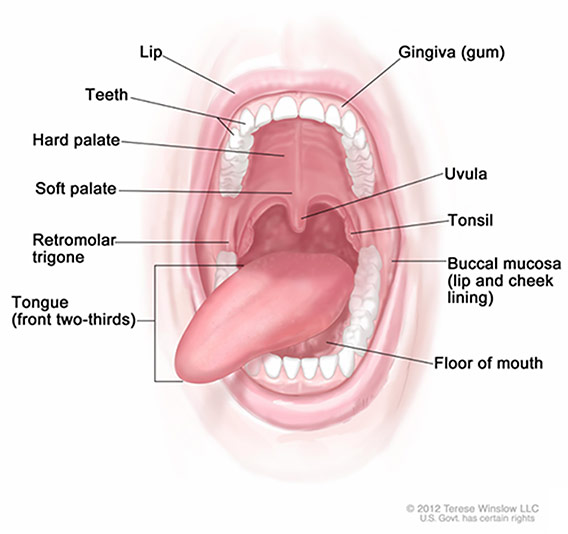
Figure: Oral cavity anatomy; shows lip, gingiva (gum), teeth, hard palate, soft palate, uvula, tonsil, retromolar trigone, buccal mucosa (lip and cheek lining), tongue (front two-thirds), and floor of mouth.
The tongue is an organ in the mouth used for tasting, talking, swallowing, and chewing. Tongue cancer occurs when cells in the tongue grow abnormally forming a cancerous (malignant) growth or tumor.
Tongue cancer is a type of head and neck cancer.
Cancer that beings in the front two-thirds of the tongue, or the part you can "stick out", is a type of oral cavity cancer. When the cancer begins in the back of the tongue, it its considered a type of oropharyngeal or throat cancer.
Additional Information
More Information
Here are some resources for learning more about tongue cancer.
- More about risk factors, symptoms, diagnosis, and treatment options for oral cavity cancer
- More about risk factors, symptoms, diagnosis, and treatment options for oropharyngeal (throat, tonsils, back of tongue) cancer
- More about clinical trials
- More about cancer prevention
- More about the health risks of smoking and ways to quit
References
All statistics in this report are based on statistics from SEER and the Centers for Disease Control and Prevention's National Center for Health Statistics. Most can be found within SEER*Explorer.
Suggested Citation
All material in this report is in the public domain and may be reproduced or copied without permission; citation as to source, however, is appreciated.
SEER Cancer Stat Facts: Tongue Cancer. National Cancer Institute. Bethesda, MD, https://seer.cancer.gov/statfacts/html/tongue.html
These stat facts focus on population statistics that are based on the U.S. population. Because these statistics are based on large groups of people, they cannot be used to predict exactly what will happen to an individual patient. To see tailored statistics, browse SEER*Explorer. To see statistics for a specific state, go to the State Cancer Profiles.
The statistics presented in these stat facts are based on the most recent data available, most of which can be found in SEER*Explorer. In some cases, different year spans may be used.
Estimates of new cases and deaths for 2026 are projections made by the American Cancer Society (ACS), based on earlier reported data.
Cancer is a complex topic. There is a wide range of information available. These stat facts do not address causes, symptoms, diagnosis, treatment, follow-up care, or decision making, although links are provided to information in many of these areas.
